Percentage increase sounds like one of those math phrases designed to make perfectly calm people reach for a calculator. Fortunately, the idea is much friendlier than the name suggests. Whether you are checking how much your salary grew, comparing this year’s sales with last year’s, measuring a price hike, or wondering exactly how dramatically your grocery bill has betrayed you, percentage increase gives you a standardized way to describe growth.
The basic idea is simple: determine how much a value increased, compare that increase with the original value, and express the result as a percentage. The standard calculation is based on the original amount because that number represents the starting point from which the growth occurred.
There is more than one convenient way to perform the calculation. In this guide, we’ll explore three ways to calculate percentage increase: the classic step-by-step formula, the ratio or growth-factor method, and an automated calculator or spreadsheet method. We’ll also cover common mistakes, percentage points, large increases, zero starting values, and plenty of real-world examples.
What Is Percentage Increase?
A percentage increase measures how much a quantity has grown relative to its original value. Instead of simply telling you that something increased by 20 units, dollars, customers, pounds, or anything else, it shows how significant that increase was compared with where you started.
Suppose a small online store receives 200 orders in January and 250 orders in February. The numerical increase is easy:
250 – 200 = 50 additional orders
But the number 50 does not tell the whole story. An increase of 50 orders would be enormous for a store that originally had 20 orders and relatively modest for one that had 20,000. Percentage increase supplies the missing context.
For the store above:
(50 / 200) × 100 = 25%
So orders increased by 25%.
The Percentage Increase Formula
The standard percentage increase formula is:
Percentage Increase = ((New Value – Original Value) / Original Value) × 100
You may also see the terms initial value, old value, starting value, or previous value. They all play the same role in this calculation.
The order matters. You subtract the original number from the new number, divide the increase by the original number, and multiply by 100.
Way 1: Use the Classic Step-by-Step Percentage Increase Formula
This is the most transparent method and usually the best one for learning the concept. Rather than cramming everything into one line, break the calculation into three manageable steps.
Step 1: Find the Amount of Increase
Subtract the original value from the new value:
Increase = New Value – Original Value
Imagine your monthly website traffic rises from 8,000 visits to 10,400 visits.
10,400 – 8,000 = 2,400
The absolute increase is 2,400 visits.
Step 2: Divide the Increase by the Original Value
Now compare the 2,400 additional visits with the starting figure of 8,000:
2,400 / 8,000 = 0.30
The decimal 0.30 represents the proportional increase.
Step 3: Multiply by 100
Convert the decimal to a percentage:
0.30 × 100 = 30%
Your website traffic increased by 30%.
Example: Calculating a Salary Increase
Suppose your annual salary increases from $60,000 to $66,000.
First, calculate the dollar increase:
$66,000 – $60,000 = $6,000
Next, divide by the original salary:
$6,000 / $60,000 = 0.10
Finally:
0.10 × 100 = 10%
The salary increase is 10%. Notice that the $6,000 raise is divided by $60,000, not $66,000. The old salary is the baseline against which the raise occurred.
Way 2: Use the Ratio or Growth-Factor Method
If you prefer fewer steps, percentage increase can also be calculated by dividing the new value directly by the original value.
The formula is:
Percentage Increase = ((New Value / Original Value) – 1) × 100
This formula may look different, but algebraically it produces the same answer as the standard formula.
Example: A Product Price Increase
Suppose a service originally costs $80 per month and later costs $100.
Divide the new price by the original price:
100 / 80 = 1.25
The result 1.25 means that the new price is 125% of the old price. But we are interested in the increase, not the total percentage of the original.
Subtract 1:
1.25 – 1 = 0.25
Convert it to a percentage:
0.25 × 100 = 25%
The price increased by 25%.
Why the Growth-Factor Method Is Useful
This approach is particularly convenient when working with repeated growth, financial models, spreadsheets, business projections, or situations in which you naturally think in terms of multipliers.
For example:
- A growth factor of 1.05 means a 5% increase.
- A growth factor of 1.20 means a 20% increase.
- A growth factor of 1.75 means a 75% increase.
- A growth factor of 2.00 means a 100% increase.
- A growth factor of 3.00 means a 200% increase.
That last example sometimes surprises people. If something goes from $50 to $150, its final value is 300% of the original, but the increase itself is 200%. The original $50 accounts for the first 100%.
Way 3: Calculate Percentage Increase With a Calculator or Spreadsheet
Manual calculations are excellent when you want to understand the math. When you have 500 rows of sales data staring at you like an army of tiny spreadsheet soldiers, automation becomes considerably more attractive.
You can use the same formula in a basic calculator, Excel, Google Sheets, or another spreadsheet program.
Using a Calculator
Suppose revenue increased from $125,000 to $147,500.
Enter:
(147500 – 125000) / 125000 × 100
The result is:
18%
Revenue therefore increased by 18%.
Using Excel or a Spreadsheet
Assume the original number is in cell A2 and the new number is in cell B2. You can enter:
=(B2-A2)/A2
Then format the result cell as a percentage.
Alternatively, the ratio method works just as well:
=B2/A2-1
Again, format the result as a percentage.
This technique is especially useful when comparing monthly revenue, advertising conversions, employee counts, inventory levels, website visitors, production output, or other data across many periods.
Percentage Increase Examples From Everyday Life
Example 1: Grocery Price
A bag of coffee rises from $12 to $15.
Increase = $15 – $12 = $3
Percentage increase = ($3 / $12) × 100 = 25%
The coffee price increased by 25%. Your morning caffeine ritual has officially become a financial indicator.
Example 2: Business Sales
A business generated $400,000 in sales last year and $460,000 this year.
Increase = $60,000
Percentage increase = ($60,000 / $400,000) × 100 = 15%
Annual sales increased by 15%.
Example 3: Social Media Followers
An account grows from 2,500 followers to 4,000.
Increase = 1,500
Percentage increase = (1,500 / 2,500) × 100 = 60%
The audience grew by 60%.
Example 4: Investment Value
Suppose an investment rises from $5,000 to $6,250, ignoring fees, taxes, and additional cash contributions for this simple example.
Increase = $1,250
Percentage increase = ($1,250 / $5,000) × 100 = 25%
The value increased by 25%.
Percentage Increase vs. Percentage Points
One of the most common percentage mistakes happens when the numbers being compared are already percentages.
Suppose a conversion rate rises from 20% to 25%.
The difference is:
25% – 20% = 5 percentage points
But the percentage increase is:
((25 – 20) / 20) × 100 = 25%
So the conversion rate increased by 5 percentage points, which represents a 25% relative increase.
Those statements describe the same change from two different perspectives, and mixing them up can make a report sound much more dramaticor much less dramaticthan reality.
Common Mistakes When Calculating Percentage Increase
Dividing by the New Value
The denominator should normally be the original value.
For an increase from 50 to 75:
Correct: (25 / 50) × 100 = 50%
Dividing by 75 instead would answer a different mathematical question.
Forgetting to Multiply by 100
If your calculation produces 0.18, the percentage increase is 18%, not 0.18%. Decimal form and percentage form are related but not identical.
Confusing Absolute Increase With Percentage Increase
Going from $100 to $120 is a $20 increase and a 20% increase. The dollar amount and percentage happen to contain similar-looking numbers here, but that is coincidence.
Going from $500 to $520 is still a $20 increase, but now the percentage increase is only 4%.
Assuming Equal Percentage Increases and Decreases Cancel Out
Suppose a $100 item increases by 20%:
$100 × 1.20 = $120
Now decrease $120 by 20%:
$120 × 0.80 = $96
You do not return to $100 because the second 20% is calculated from a different starting value.
What Happens When the Original Value Is Zero?
The ordinary percentage increase formula cannot be used when the original value is zero because it would require division by zero.
For example, suppose a new company goes from zero customers to 50 customers. Saying it gained 50 customers is perfectly valid. However, a conventional percentage increase from zero is undefined.
In situations like this, report the absolute increase or explain that the metric started from a zero baseline rather than presenting a misleading percentage.
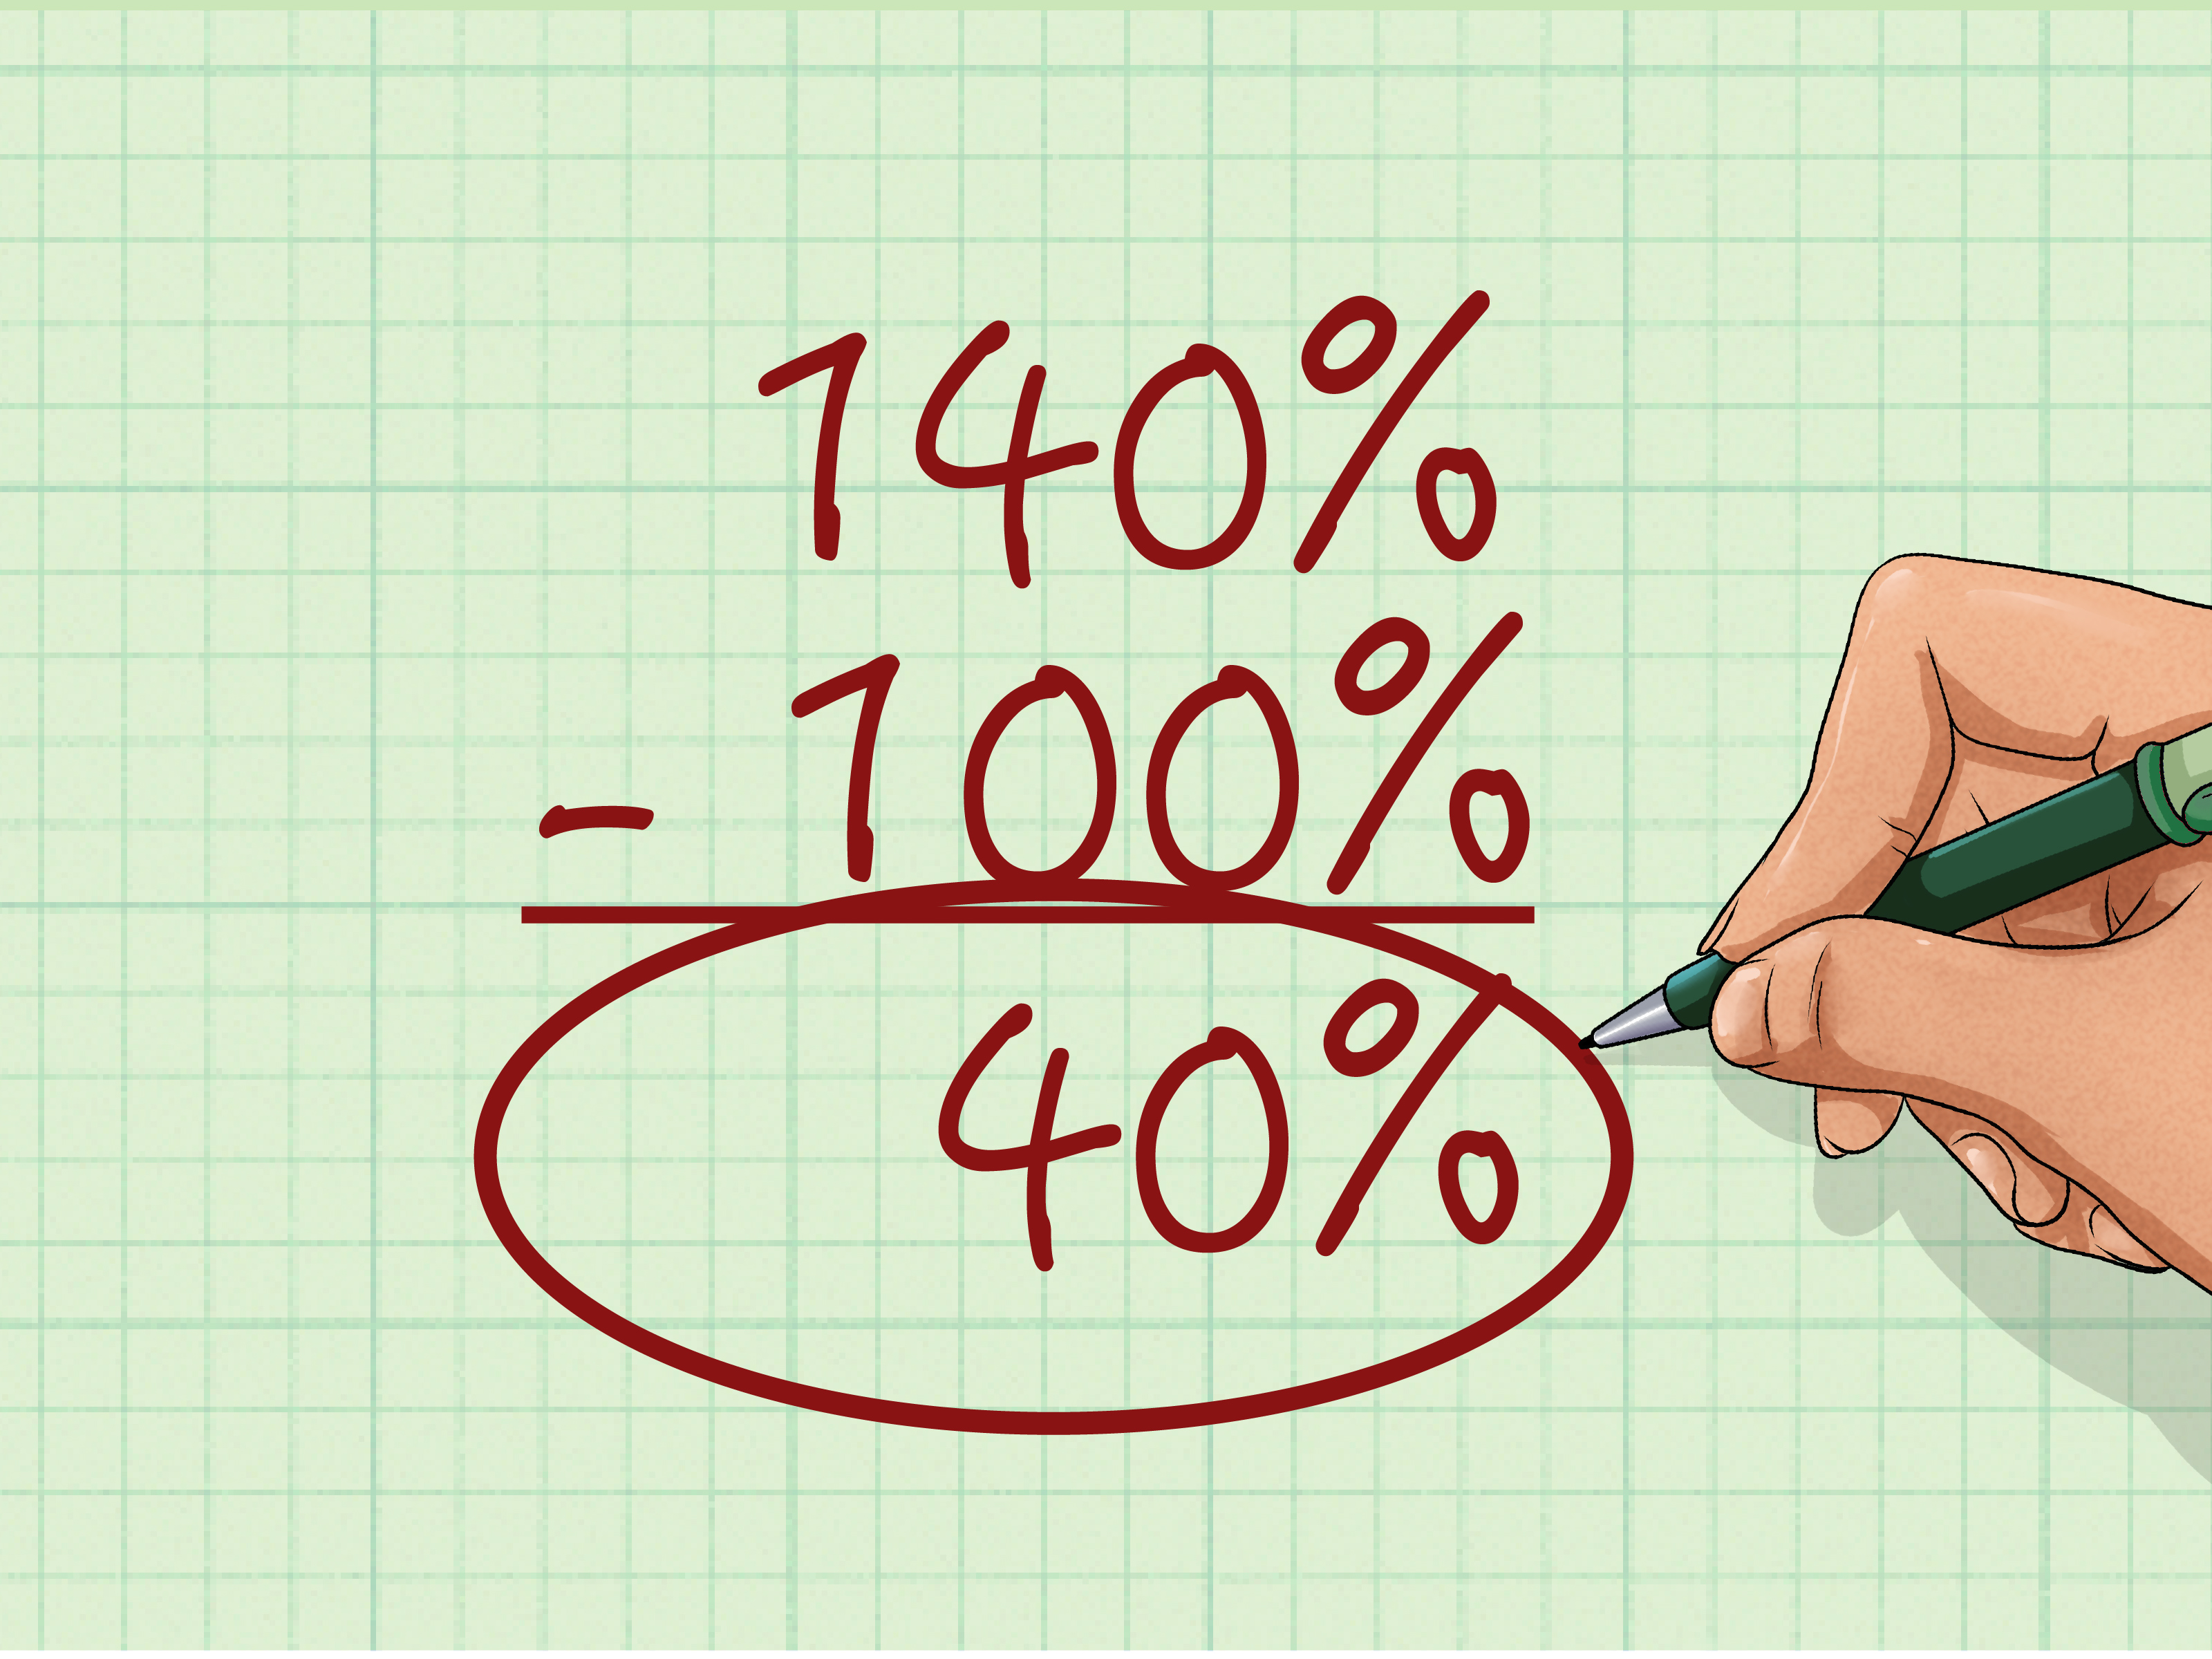
Can Percentage Increase Be Greater Than 100%?
Absolutely. There is no rule saying an increase has to stop at 100%.
If a value doubles, the increase is 100%.
If a value triples, the increase is 200%.
For example, if weekly sales rise from 100 units to 350 units:
((350 – 100) / 100) × 100 = 250%
The final sales level is 350% of the original level, while the increase is 250%.
When Is Percentage Increase More Useful Than Absolute Change?
Percentage increase is particularly valuable when comparing changes across values of different sizes.
Imagine Store A increases monthly sales by $20,000, while Store B increases sales by $5,000. At first glance, Store A appears to have performed better.
Now suppose Store A went from $1,000,000 to $1,020,000. That is a 2% increase. Store B went from $10,000 to $15,000, a 50% increase.
The absolute figures and relative figures tell different stories. Neither measure is automatically superior; good analysis often presents both.
Practical Experiences With Calculating Percentage Increase
One useful lesson from working with percentage increase is that the arithmetic is usually the easy part. Choosing the correct starting value is where most problems happen. When numbers come from real reports rather than tidy textbook examples, there may be several possible baselines: last month, last year, a target, an average, or the first observation in a dataset.
Consider monthly website traffic. Suppose a site receives 100,000 visits in January, 105,000 in February, and 130,000 in March. Saying March traffic increased 23.8% may be correct if February is the baseline, because:
((130,000 – 105,000) / 105,000) × 100 ≈ 23.8%
But compared with January, March traffic increased 30%. Both numbers are mathematically correct. They simply answer different questions. That is why a good report should clearly state the comparison period.
Another practical lesson appears in business performance. A startup may increase revenue from $10,000 to $20,000 and proudly announce 100% growth. A larger company might increase revenue from $10 million to $11 million and report only 10% growth. The startup has the stronger percentage increase, while the established company generated vastly more additional revenue. Percentages provide scale, but they should not erase the underlying numbers.
Rounding deserves attention too. If sales increase from 317 units to 342 units, the calculation gives approximately 7.886%. Reporting that as 7.9% is usually easier to read than displaying 7.886435331%, which looks impressive mainly because your calculator refused to stop talking. For financial statements, scientific work, or formal analysis, keep enough precision during the calculation and round only the final displayed result according to the context.
Spreadsheets also make percentage increase easier, but they introduce a different type of error: formulas can be copied incorrectly. If the original value is in column B and the new value is in column C, a formula such as =(C2-B2)/B2 can be filled down hundreds of rows. Before trusting the entire sheet, manually verify several rows. One mistaken cell reference can turn a beautiful dashboard into a beautifully formatted collection of nonsense.
Percentage changes also become especially interesting when they occur repeatedly. Three consecutive 10% increases do not equal a total increase of exactly 30%. Starting with 100, the sequence becomes 110, then 121, then 133.1. The overall increase is 33.1% because each new increase is applied to a larger base. This is the basic effect behind compounding.
A final practical habit is to ask what the percentage actually means before celebrating or panicking. A 200% increase sounds enormous, but if complaints rose from one case to three, the absolute difference is only two. Meanwhile, a seemingly modest 3% increase applied to millions of customers or billions of dollars could be extremely significant.
The calculation is therefore only the beginning. Strong interpretation combines the percentage increase, the absolute difference, the baseline, the time period, and the real-world context. Mathematics supplies the number; good judgment supplies the meaning.
Conclusion
Learning how to calculate percentage increase gives you a practical tool for analyzing prices, salaries, sales, investments, traffic, populations, business performance, and countless other forms of changing data.
The most familiar method is:
Percentage Increase = ((New Value – Original Value) / Original Value) × 100
You can calculate it step by step, use the equivalent ratio formula ((New Value / Original Value) – 1) × 100, or automate the process with a calculator or spreadsheet. Whichever method you choose, remember the golden rule: compare the change with the original value.
Once that idea becomes second nature, percentage increase stops feeling like mysterious math vocabulary and starts behaving like what it really is: a compact way of answering the question, “How much bigger did this get compared with where it started?”
Note: Examples in this guide are simplified for educational purposes. When percentages are used for financial, investment, scientific, or business decisions, consider fees, contributions, timing, data definitions, rounding rules, and other factors that may affect the appropriate calculation.