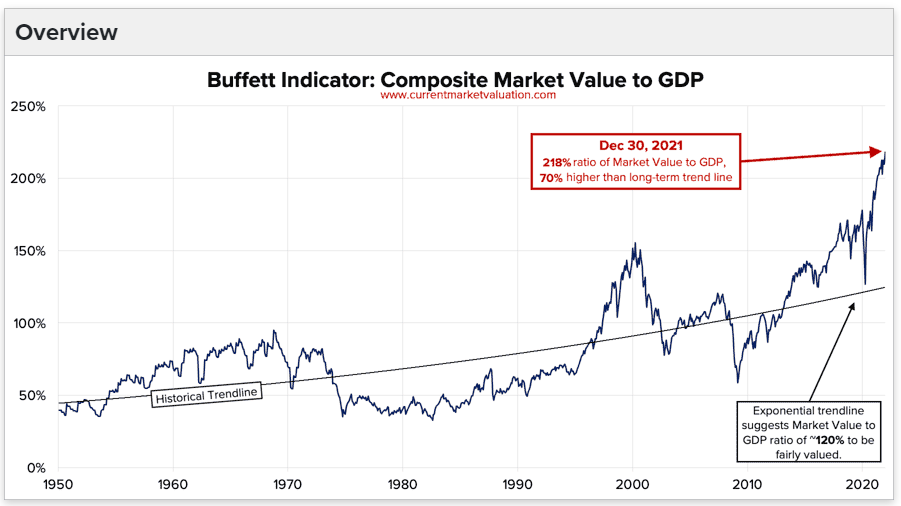
The Buffett Indicator is flashing a message that is difficult to miss: U.S. stocks are expensive. Not “the guacamole costs extra” expensive, either. By several widely followed calculations, the total value of the American stock market is now more than twice the size of annual U.S. economic output. That places the market near the most elevated valuation territory in the indicator’s modern history.
That does not automatically mean a crash is scheduled for next Tuesday at 10:17 a.m. Markets do not accept calendar invitations from valuation models. It does mean investors are paying unusually high prices for each dollar of economic activity, leaving less room for disappointing earnings, stubborn interest rates, weaker growth, or a sudden outbreak of common sense.
As of August 1, 2026, one frequently updated estimate placed the Buffett Indicator at approximately 229.9%, based on a U.S. total market value of about $74.7 trillion. Other methodologies using quarterly Federal Reserve data or the FT Wilshire 5000 recently produced readings around 214% to 219%. The numbers differ because data providers use different market-cap definitions, averaging periods, GDP estimates, and timing conventions. The verdict, however, is remarkably consistent: the U.S. stock market is substantially overvalued by historical standards.
What Is the Buffett Indicator?
The Buffett Indicator, also called the market-cap-to-GDP ratio, compares the value of publicly traded stocks with the size of the national economy:
Buffett Indicator = Total U.S. stock market capitalization ÷ U.S. GDP × 100
Suppose the total market value of U.S. stocks is $75 trillion and annualized gross domestic product is $32.5 trillion. The calculation would be approximately 231%. In plain English, investors collectively value publicly traded American companies at about 2.31 times one year of U.S. economic production.
Warren Buffett popularized the measure in a 2001 discussion of long-term market returns, describing it as probably the best single snapshot of where aggregate valuations stand. Its appeal is obvious. Instead of estimating the value of thousands of companies separately, the ratio asks one big-picture question: How much are investors paying for the corporate assets tied to the economy that supports them?
Why the Indicator Is Useful
Over long periods, corporate revenue and profit cannot permanently outrun the economy that produces customers, workers, investment, and demand. Stock prices can sprint ahead for years, but earnings eventually need to justify the trip. When market capitalization rises much faster than nominal GDP, future returns become increasingly dependent on strong profit growth or investors agreeing to pay even higher valuation multiples.
Why the Indicator Is Not Perfect
The numerator and denominator are not identical creatures. Market capitalization is a forward-looking snapshot of expected future corporate profits. GDP is a backward-looking flow of domestic production measured over a year. Comparing them is useful, but it is not the financial equivalent of comparing two apples. It is more like comparing an apple orchard’s sale price with one year of fruit production.
What Is the Buffett Indicator Saying Right Now?
The current message is “caution,” printed in a very large font. A daily estimate of 229.9% on August 1, 2026, classified the market as significantly overvalued. A quarterly Federal Reserve-based version stood at 218.1% for the first quarter of 2026, while a concurrent FT Wilshire 5000-to-GDP version was about 214.1%. Another independent model calculated 219% and placed the ratio roughly 2.1 standard deviations above its historical trend.
Those readings are not merely a little above average. They sit near record territory. Depending on the exact series, the present ratio rivals or exceeds levels associated with the dot-com era and the post-pandemic valuation peak. A reading above 200% does not tell investors what stocks will do next month, but it tells them that the starting price for long-term ownership is unusually demanding.
GDP Is Growing, but Stock Values Grew Faster
The U.S. economy is not standing still. The Bureau of Economic Analysis reported that real GDP increased at a 1.5% annualized rate in the second quarter of 2026. Current-dollar GDP rose at a 7.9% annualized rate, while real final sales to private domestic purchasers increased 3.9%. A growing nominal economy lifts the denominator and can gradually reduce the Buffett Indicator.
The challenge is that stock market capitalization has expanded even faster. When share prices surge while GDP moves at a steadier pace, the ratio stretches. It can normalize through a market decline, faster economic growth, years of sideways stock prices, or some combination of all three. Valuation gravity does not specify which landing route will be used.
Other Valuation Measures Are Also Elevated
The Buffett Indicator is not shouting alone. The Shiller cyclically adjusted price-to-earnings ratio, which compares the S&P 500 with 10 years of inflation-adjusted earnings, was about 40.9 at the July 31, 2026 close. Its long-run mean was approximately 17.4, and its historical high was about 44.2 during the dot-com boom. The conventional trailing S&P 500 P/E ratio was around 28.8.
Meanwhile, the 10-year Treasury yield was about 4.75%, the S&P 500 earnings yield was roughly 3.47%, and the dividend yield was near 1.07%. That combination matters. Investors are accepting a relatively thin earnings and dividend yield from stocks while high-quality bonds offer meaningful income. Stocks may still outperform, but the hurdle is no longer lying flat on the ground.
Market concentration adds another layer of risk. The 10 largest companies represented about 36.4% of the S&P 500 as of late May 2026. When a small group of mega-cap businesses carries a large share of an index, broad-market valuation can depend heavily on whether those companies continue delivering exceptional growth.
Why Today’s High Reading May Be Partly Justified
A high Buffett Indicator is not proof that investors have collectively misplaced their calculators. Several structural changes can support a higher normal range than in previous decades.
American Companies Earn Money Worldwide
GDP measures production inside the United States, but many U.S.-listed companies sell products and services around the globe. Foreign sales accounted for about 28% of S&P 500 revenue in 2024. Those overseas profits increase market capitalization without appearing fully in U.S. GDP, which can make the ratio look richer than an entirely domestic comparison would.
Modern Businesses Need Less Physical Capital
Software, platforms, patents, data, brands, and network effects can produce large profits without requiring factories on every corner. Accounting systems often treat research, software development, and brand-building as expenses rather than long-lived assets. As the economy becomes more intangible, highly profitable companies can command enormous market values relative to measured domestic output.
The Public Market Has Changed
Today’s listed universe contains many mature, scalable, highly profitable firms, while numerous younger and less profitable businesses remain private for longer. Share repurchases can also reduce public share counts and support per-share metrics. The modern stock market is not a perfect miniature of the entire economy, so comparisons with readings from the 1970s or 1980s require context.
Exceptional Profit Margins Matter
If technology, automation, artificial intelligence, and global scale allow corporate profits to capture a larger share of economic output, investors may rationally pay more for stocks. The catch is that high margins attract competition, regulation, taxation, and ambitious entrepreneurs who enjoy ruining comfortable forecasts.
Why the Indicator Still Deserves Respect
Structural explanations can justify a higher average ratio, but they do not make price irrelevant. The phrase “this time is different” sometimes describes genuine change. It has also been the unofficial anthem of several expensive market cycles.
High starting valuations have historically been associated with lower long-term returns, even though the relationship is weak over short horizons. GuruFocus’s valuation model estimated an annualized return of roughly negative 0.7% over eight years from its August 1 reading, including dividends. That is a model output, not a promise. Vanguard’s broader capital-markets model was less severe but still restrained, projecting approximately 4.2% to 6.2% annualized for U.S. equities over 10 years after valuations increased from already elevated levels.
The important point is not that one forecast must be correct. It is that multiple frameworks suggest future U.S. stock returns may be lower than the unusually strong gains investors have recently enjoyed. High prices borrow optimism from the future. Eventually, the future sends an invoice.
Three Ways the Buffett Indicator Could Normalize
1. Earnings and GDP Catch Up
This is the optimistic path. Artificial intelligence investment, productivity growth, resilient consumer spending, and strong corporate margins could lift nominal GDP and earnings fast enough to support current prices. Stocks might rise more slowly than the economy, allowing the ratio to decline without a major bear market.
2. Stocks Move Sideways for Years
Valuation compression does not always arrive as a dramatic collapse. The market could deliver choppy, modest returns while GDP and corporate profits grow underneath it. Investors would still earn dividends, but inflation could make the real result feel like running on a treadmill while carrying groceries.
3. Prices Fall
If earnings disappoint, interest rates remain high, or investors demand a larger risk premium, market capitalization could decline faster than GDP. A 20% market drop, with GDP unchanged, would reduce a 230% ratio to about 184%. That would still be elevated, illustrating how far valuations have stretched.
How Should Investors Respond?
The Buffett Indicator is better used as a risk-management gauge than a buy-or-sell button. Valuation has historically been poor at predicting next week and more useful for shaping expectations over the next decade. Charles Schwab notes that the ratio has remained above traditional overvaluation thresholds for extended periods during bull markets. Selling everything solely because the indicator looks alarming can be just as damaging as pretending valuation never matters.
- Rebalance instead of panicking. Trim positions that have grown far beyond their intended portfolio weight and redirect funds toward neglected assets.
- Diversify beyond mega-cap U.S. growth. Value stocks, international equities, high-quality bonds, and selected smaller companies may offer different valuation profiles.
- Use dollar-cost averaging. Regular contributions reduce the pressure to identify one perfect entry point.
- Keep leverage modest. Expensive markets can become more expensive, but they can also reprice violently when expectations change.
- Raise the quality bar. Favor durable cash flow, manageable debt, pricing power, and sensible purchase prices over fashionable stories with decorative profits.
Experience-Based Lessons From Watching Expensive Markets
The most useful experience-based lesson is that an overvalued market can stay overvalued long enough to embarrass anyone who treats a valuation ratio as a stopwatch. Investors who exited completely when the indicator first crossed a scary-looking line in earlier bull markets often watched stocks continue climbing. The signal was not necessarily wrong; the timing assumption was. Valuation describes the price of risk, not the departure time of the next bear market.
A second lesson is that moving entirely to cash creates a new problem: deciding when to return. Falling markets rarely send a polite notification that says, “The bottom is complete; normal optimism may resume.” News usually looks worst near attractive entry points. An investor who sells because the Buffett Indicator is high may hesitate to buy after a decline because earnings are weakening, unemployment is rising, or headlines are terrifying. Cash can reduce volatility, but without a re-entry rule it can become a very comfortable long-term mistake.
Third, rebalancing tends to be more practical than prediction. Imagine a portfolio designed to hold 60% stocks and 40% bonds. After a powerful stock rally, it might drift to 72% stocks. Returning to the original allocation automatically sells some appreciated assets and buys relatively cheaper ones. No dramatic forecast is required. The investor simply restores the amount of risk chosen before the market started handing out confidence like free samples.
Fourth, index-level valuation can hide enormous differences underneath the surface. A lofty Buffett Indicator does not mean every company is equally expensive. During concentrated markets, a handful of giant companies can pull up the valuation of the entire index. Some sectors, international markets, and individual businesses may still trade at reasonable prices. The practical response is deeper research, not the assumption that all stocks belong in one overpriced bucket.
Fifth, strong businesses can still be poor investments when bought at heroic prices. A company may dominate its industry, grow revenue rapidly, and produce excellent margins, yet disappoint shareholders if the stock price already assumes near-perfect execution. The better the story, the more carefully an investor should inspect what has already been priced in.
Finally, a written plan is more valuable than a dramatic opinion. Investors can decide in advance how they will respond to a 10%, 20%, or 30% decline; how often they will rebalance; how much cash they need; and which valuation levels would justify increasing long-term exposure. That preparation turns the Buffett Indicator from a frightening headline into a useful portfolio input. The goal is not to predict every market turn. It is to avoid making one emotional decision large enough to wreck a sound financial plan.
Conclusion: Expensive Does Not Mean Uninvestable
What does the Buffett Indicator say about stocks right now? It says the U.S. market is historically expensive, with current estimates generally ranging from roughly 214% to 230% depending on methodology and timing. Other measuresincluding the Shiller CAPE ratio, conventional P/E ratios, low dividend yields, and extreme index concentrationsupport the same broad conclusion.
That warning should lower return expectations and raise attention to diversification, position sizing, quality, and valuation discipline. It should not automatically trigger an all-or-nothing retreat from equities. The indicator cannot tell investors when a correction will begin, how deep it will be, or whether rapid earnings growth will justify today’s prices.
The sensible interpretation is neither “sell everything” nor “valuations no longer matter.” It is simpler: future returns are likely to be more sensitive to growth disappointments, interest rates, and investor sentiment than they would be from a cheaper starting point. Keep investing, but stop assuming the market owes everyone another decade of effortless double-digit gains.
Note: Market values change daily, GDP figures are revised, and Buffett Indicator methodologies vary. This article is educational and does not provide personalized investment advice.
Research synthesis consulted data and analysis from the U.S. Bureau of Economic Analysis, Federal Reserve, Advisor Perspectives, GuruFocus, Current Market Valuation, Vanguard, Charles Schwab, S&P Dow Jones Indices, Morningstar, Multpl, Longtermtrends, YCharts, and Research Affiliates.