Charts are the tuxedos of information: polished, persuasive, and occasionally hiding a pair of questionable socks underneath. A clean line graph can make a trend look inevitable. A colorful dashboard can make a business feel under control. A candlestick chart can convince an investor that the market is whispering secrets directly into their coffee mug. But here is the uncomfortable truth: charts are not truth itself. They are selected views of truth.
That does not make charts bad. Far from it. Data visualization is one of the most powerful tools we have for understanding business performance, public health, economics, investing, education, marketing, and everyday decision-making. A well-made chart can reveal a pattern that would be invisible in a spreadsheet. It can turn a thousand rows of data into one “Aha!” moment. It can also, when handled carelessly, turn a complicated reality into a confident misunderstanding wearing a nice font.
The title “What the Charts Don’t Tell You” is not an attack on data. It is a friendly warning label. Charts can show what happened, but they often struggle to explain why it happened, who was left out, how reliable the numbers are, what incentives shaped the story, and what could happen next. In a world filled with dashboards, market graphs, social media infographics, health statistics, and performance reports, learning to read beyond the chart is no longer optional. It is basic survival, like knowing not to microwave aluminum foil.
Charts Are Powerful Because They Simplify Reality
The main reason charts work is also the main reason they can mislead: they simplify. A bar chart compares categories. A line chart shows movement over time. A scatter plot suggests relationships. A pie chart shows parts of a whole, assuming no one has tried to squeeze 17 slices into it like a statistical pizza tragedy.
Good data visualization reduces mental effort. Instead of scanning columns of numbers, the reader can quickly see direction, scale, contrast, and outliers. That is why businesses use dashboards to track sales, marketers use charts to monitor campaigns, economists use graphs to explain labor trends, and health agencies use maps and visual tools to communicate risk. When designed well, charts help technical and nontechnical audiences understand the same information faster.
But every simplification removes something. A chart may remove uncertainty. It may remove context. It may remove the messy human behavior behind the numbers. It may remove the difference between correlation and causation. By the time the chart reaches a meeting, a news article, or a social feed, it may look so clean that nobody remembers the original data had muddy boots.
The First Thing Charts Hide: Where the Data Came From
Before asking what a chart shows, ask where the data came from. Was it collected from a survey, a database, a sample, a government report, a company dashboard, a trading platform, a wearable device, or a customer feedback form? Each source has strengths, limits, and blind spots.
Survey data, for example, depends on who responded, how questions were worded, and whether the sample represents the larger population. Business data depends on what systems were tracking and what employees entered correctly. Website analytics depend on tracking setup, consent settings, bots, blocked cookies, attribution rules, and whether someone’s cousin accidentally refreshed the page 47 times. Market data may be accurate as a price record but incomplete as a guide to investor behavior.
A chart rarely says, “By the way, this number was collected from a small sample, filtered twice, rounded, seasonally adjusted, and then lovingly squeezed into a slide deck five minutes before the meeting.” It should, but charts are famously bad at small talk.
Uncertainty Is Often Missing From the Picture
Many charts show a single number as if it were carved into stone. In reality, many numbers are estimates. Census data, economic indicators, public opinion surveys, and health statistics often include margins of error, confidence intervals, standard errors, or other measures of uncertainty. These details matter because they tell us how much confidence we should place in a number.
Imagine two cities are shown on a chart. City A has an estimated unemployment rate of 4.8 percent. City B has 5.1 percent. A dramatic headline might declare that City B is doing worse. But if the margin of error is large, the difference may not be meaningful. The chart says “difference.” The uncertainty says “calm down, detective.”
This is one of the most common problems in data interpretation. People love ranking things: best states, worst cities, top schools, fastest-growing brands, healthiest diets, most productive teams. Rankings feel decisive. But when the data contains uncertainty, tiny differences can become fake drama. A chart may turn a statistical shrug into a championship trophy.
Time Frames Can Change the Entire Story
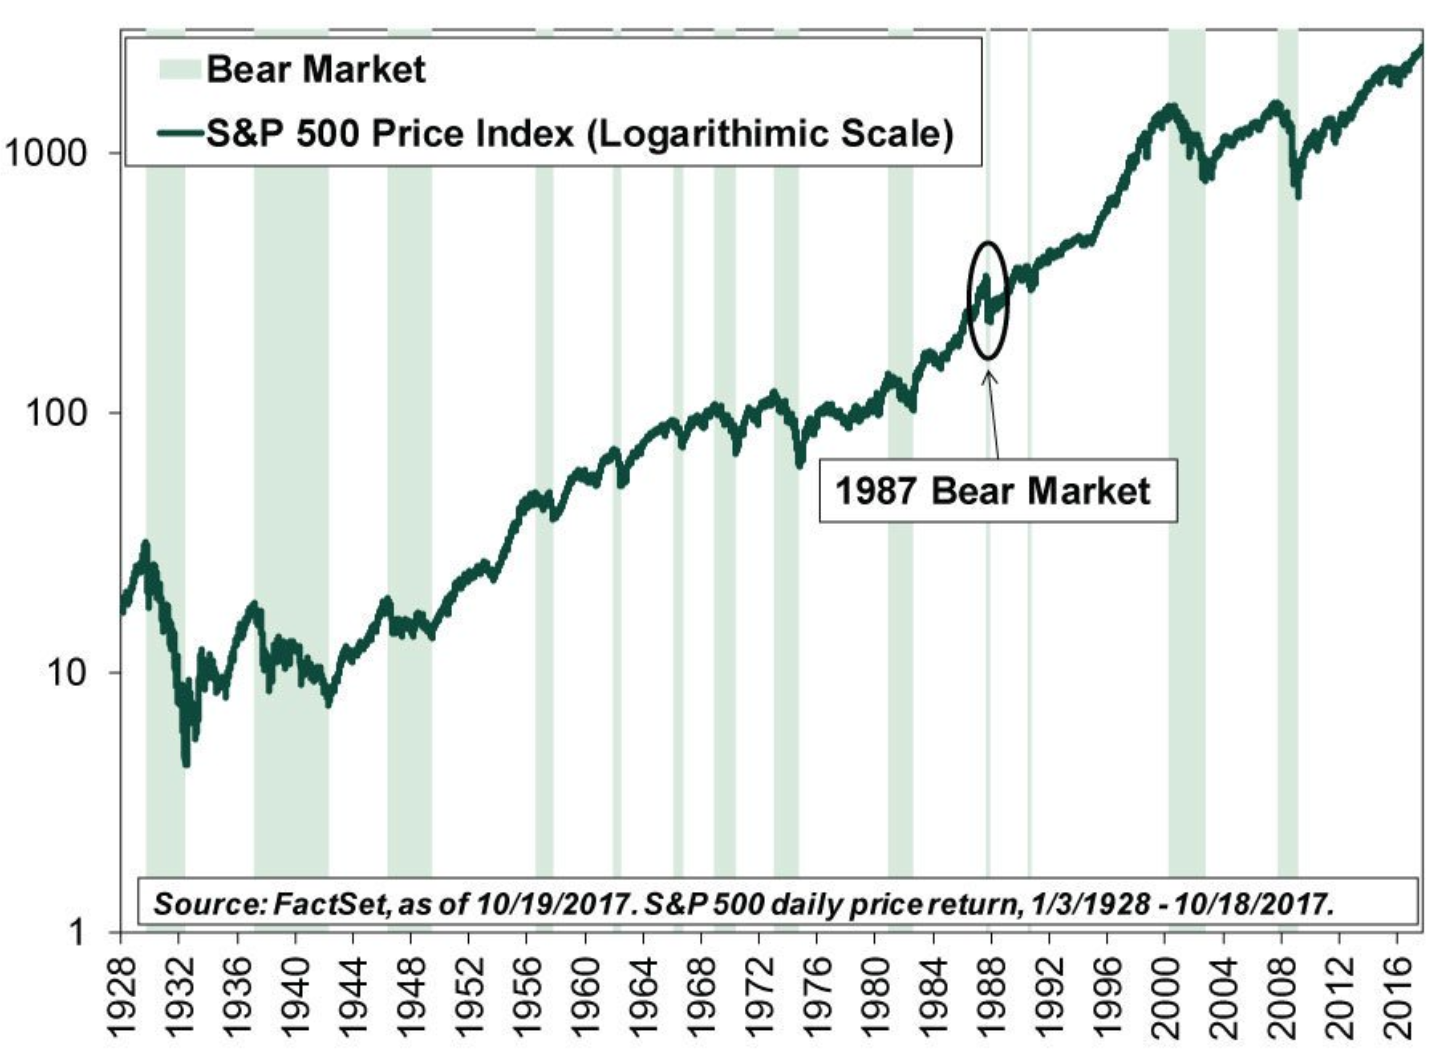
One of the easiest ways to change a chart’s message is to change the time frame. A stock chart over one day may look terrifying. Over five years, the same movement may look like a hiccup. A company’s sales may look fantastic compared with last month but flat compared with last year. A public health trend may look alarming during a seasonal spike but normal across a decade.
Charts do not always explain why a particular start date was chosen. That choice can make a trend look stronger, weaker, scarier, or more impressive. For example, beginning a chart at the lowest point of a crisis can make recovery look spectacular. Starting at the highest point can make normal fluctuation look like collapse. This is why smart readers ask, “Why does the chart start there?”
The same applies to scale. A y-axis that begins at 95 instead of zero can make a small change look like a mountain range. A compressed axis can make a major change look boring. Neither method is automatically dishonest, but both require context. In data visualization, scale is not decoration. Scale is meaning.
Averages Can Be Sneaky Little Rascals
Averages are useful, but they can hide important differences. The average customer may be satisfied while a specific customer segment is furious. The average employee may be productive while one team is drowning. The average income in an area may look high because a small number of very high earners pull the number upward. The average hospital wait time may look acceptable while certain patients wait much longer.
This is why medians, ranges, distributions, and segmentation matter. A single average can flatten reality until it resembles a pancake. Pancakes are great for breakfast, not for serious analysis.
For example, if a company reports that average response time improved from 10 hours to 5 hours, that sounds excellent. But what if premium customers receive answers in 30 minutes while basic customers wait 24 hours? What if simple tickets are handled quickly while urgent complaints sit unresolved? The chart shows improvement. The customer experience may tell a more complicated story.
Correlation Is Not the Same as Causation
Charts are very good at showing that two things moved together. They are not always good at proving one caused the other. Ice cream sales and swimming injuries may both rise in summer, but ice cream is not sneaking around pushing people into pools. At least, not according to current science.
In business, a chart may show that sales increased after a marketing campaign. That does not automatically prove the campaign caused the increase. Seasonality, competitor behavior, pricing changes, media coverage, economic conditions, or product availability may have played a role. In health data, a chart may show that two conditions appear together, but underlying factors such as age, income, access to care, geography, or behavior may explain the relationship.
The phrase “the chart proves” should make every analyst reach for a seatbelt. Charts suggest. Charts reveal. Charts invite questions. They rarely prove anything alone.
What Financial Charts Don’t Tell You
Financial charts deserve their own warning label because money has a magical ability to make people confident and sweaty at the same time. A price chart can show where a stock, fund, index, or cryptocurrency has been. It cannot tell you your risk tolerance, your time horizon, your emergency savings situation, your tax position, your investment fees, or whether you will panic-sell during the next downturn while muttering, “I am being rational.”
Market charts also struggle to show risk fully. A smooth upward line may hide volatility, drawdowns, liquidity problems, concentration risk, or leverage. A short-term price pattern may look predictive, but markets are influenced by earnings, interest rates, inflation expectations, regulation, geopolitics, investor psychology, and plain old randomness. The chart may be neat. The market is a raccoon in a filing cabinet.
Responsible investing requires more than reading lines on a screen. Investors need to review disclosures, understand fees, consider diversification, evaluate risk, and avoid assuming that recent performance guarantees future results. A chart can be a starting point, not a crystal ball.
What Business Dashboards Don’t Tell You
Business dashboards can be incredibly useful. They track revenue, leads, conversion rates, churn, customer acquisition cost, retention, inventory, productivity, and dozens of other key performance indicators. But dashboards can also create the illusion that if something is measurable, it is manageable, and if it is not measurable, it does not exist.
That illusion is dangerous. A dashboard may show that customer support tickets decreased. Great! Or maybe customers gave up. A chart may show that employees are completing more tasks. Wonderful! Or maybe they are rushing through low-quality work because the metric rewards speed. A graph may show that website traffic increased. Fantastic! Or maybe the traffic is irrelevant, low-intent, or generated by bots with suspiciously strong opinions about your landing page.
Metrics shape behavior. If a sales team is measured only on calls made, people may make more calls, not better calls. If a content team is measured only on pageviews, they may chase sensational headlines instead of useful information. If a company tracks average handle time in customer service, agents may end calls quickly instead of solving problems completely. The chart shows the target. It may not show the damage caused by chasing it blindly.
What Health and Public Data Charts Don’t Tell You
Health charts can help the public understand disease trends, risk factors, screening rates, hospital capacity, vaccination patterns, and outcomes. They can also hide reporting delays, testing access, demographic differences, geographic gaps, and changes in definitions.
For example, a decline in reported cases does not always mean a disease is truly declining. Testing may have dropped. Reporting systems may have changed. People may be using at-home tests that never enter official counts. A map showing higher rates in one county may reflect higher risk, better detection, older population, environmental exposure, or better data collection.
Public health data is especially powerful when paired with local knowledge. A chart can identify a hotspot. Community context can explain transportation barriers, housing conditions, clinic access, language needs, work schedules, or trust issues that affect outcomes. Numbers can point to a problem, but people explain what the problem feels like at ground level.
Design Choices Quietly Shape Interpretation
Charts communicate through design. Color, order, labels, contrast, spacing, chart type, annotation, and visual hierarchy all influence what readers notice first. A bright red bar screams danger. A muted gray line whispers, “I am here too, but nobody invited me to the headline.”
Good chart design uses visual cues to support understanding. The best charts make the main takeaway clear without forcing readers to solve a puzzle. The worst charts decorate confusion. Too many colors, 3D effects, unlabeled axes, tiny legends, and overloaded dashboards can turn data into confetti.
Choosing the right chart type matters. Line charts usually work well for trends over time. Bar charts are strong for comparisons. Scatter plots help show relationships. Maps are useful for geography but can exaggerate land area over population. Pie charts can work for simple part-to-whole relationships, but they become difficult when slices are similar or numerous. Donut charts are pie charts that went to design school and came back with confidence.
Accessibility Is Not Optional
A chart that cannot be understood by people using screen readers, mobile devices, low-vision settings, or color-blind-friendly displays is not a complete communication tool. Accessibility is not a bonus feature; it is part of accuracy. If important information is available only through color, tiny labels, or an image without meaningful text, some readers are excluded from the story.
Accessible charts need clear titles, descriptive labels, sufficient contrast, readable text, alternative descriptions, and, when appropriate, data tables. Mobile testing matters too. A dashboard that looks elegant on a giant monitor may become a microscopic ant farm on a phone. Since many readers consume information on mobile devices, chart design should meet people where they actually are, not where the designer’s 32-inch monitor wishes they were.
The Human Story Behind the Numbers
The biggest thing charts do not tell you is the human story. A workforce chart may show turnover rising. It does not show the manager who never listens, the commute that became impossible, the employee caring for a sick parent, or the new policy that sounded brilliant in a meeting and terrible in real life.
A school performance chart may show test scores. It does not show class size, neighborhood stress, teacher burnout, internet access, language barriers, or whether students had breakfast. A sales chart may show declining revenue. It does not show that customers are confused by pricing, tired of poor onboarding, or quietly choosing a competitor with better support.
Charts are maps, not territories. They help us navigate, but they are not the terrain. The real world has weather, traffic, potholes, detours, and one guy honking for no reason. Data analysis becomes stronger when charts are combined with interviews, observation, domain expertise, historical context, and plain curiosity.
How to Read Charts More Carefully
1. Ask what is being measured
Do not assume the chart measures what the headline says it measures. “Engagement” could mean clicks, comments, watch time, shares, repeat visits, or someone accidentally tapping the screen while eating chips. Definitions matter.
2. Check the source and method
Look for information about sample size, collection method, time period, exclusions, and adjustments. A chart without methodology is not useless, but it is unfinished.
3. Look for missing context
Ask what else changed during the same period. Pricing, policy, seasonality, economic conditions, platform algorithms, product changes, and competitor moves can all affect the numbers.
4. Watch the scale
Check whether the axis starts at zero, whether the time frame is cherry-picked, and whether the visual size of a change matches its practical importance.
5. Separate signal from noise
Not every movement deserves a dramatic meeting. Some changes are meaningful. Others are normal variation wearing a tiny cape. Compare short-term movement with longer-term trends before making big decisions.
Why Better Questions Beat Prettier Charts
Pretty charts are nice. Useful questions are better. The strongest analysts, leaders, investors, marketers, researchers, and journalists do not simply ask, “What does the chart say?” They ask, “What is missing? What would change my mind? Who benefits from this interpretation? What would I need to know before acting?”
This is where data literacy becomes a competitive advantage. Anyone can screenshot a graph. Fewer people can challenge its assumptions without sounding like they are trying to ruin everyone’s afternoon. The goal is not to become cynical about charts. The goal is to become intelligently skeptical.
A good chart should start a conversation, not end one. It should invite better questions, sharper thinking, and more responsible decisions. When a chart is treated as the final answer, it becomes dangerous. When it is treated as one piece of evidence, it becomes powerful.
Experience: Lessons From Reading Between the Lines
One of the most useful experiences related to this topic is watching how quickly people react to a chart before they understand it. In a business setting, a single downward line can change the mood of an entire room. Shoulders tighten. Coffee cups freeze midair. Someone says, “We need action,” which is corporate language for “I have not yet read the axis.” Then, after a closer look, the panic often softens. Maybe the chart compares a holiday week with a normal week. Maybe a tracking code broke. Maybe one large customer renewed late. The line was real, but the first interpretation was not.
Another common experience is seeing dashboards become emotional objects. Teams may love metrics that make them look successful and distrust metrics that expose weak spots. This is human. Nobody wants to be judged by a number that lacks context. A customer support team may appear slower because it handles harder cases. A content team may appear less productive because it is improving old articles instead of publishing new ones. A sales team may appear to underperform because it inherited poor-quality leads. The chart is not lying, but it may be telling only chapter seven of a twenty-chapter book.
In marketing, charts can be especially seductive. A campaign graph may show a spike in traffic, and everyone wants to celebrate. Celebration is allowed. Confetti is optional. But the next questions matter more: Did the visitors stay? Did they convert? Were they the right audience? Did the traffic come from a source that will last, or was it a one-day sugar rush? A chart can show attention. It cannot automatically show trust, loyalty, or profit.
In investing, the experience is even more intense because the chart is tied to fear and hope. A rising line makes people feel like geniuses. A falling line makes them question every life choice since middle school. Yet the chart does not know your goals. It does not know whether you need the money next month or in twenty years. It does not know whether you understand the risk. The price line is information, not advice.
The lesson from all these experiences is simple: charts are best used as invitations. They invite us to investigate, not overreact. They invite us to ask better questions, not decorate weak assumptions. They invite us to combine numbers with judgment. The smartest person in the room is not always the one with the most colorful dashboard. Often, it is the person who quietly asks, “What are we not seeing here?” That question may not fit neatly on a chart, but it can save a project, a budget, a strategy, or a very awkward Monday meeting.
Conclusion: Respect the Chart, Question the Story
Charts are essential tools for modern decision-making. They help us see patterns, compare performance, understand trends, and communicate complex information quickly. But charts do not speak for themselves. People build them, label them, crop them, color them, interpret them, and sometimes weaponize them in PowerPoint battles no one asked for.
The next time you see a chart, admire its clarity, then look for its silence. Ask about the data source, the time frame, the scale, the uncertainty, the missing groups, the incentives, and the real-world context. A chart may show you what changed. Your job is to figure out what it means.
Note: This article is for educational and informational purposes. It encourages careful interpretation of charts and data, not distrust of data itself. The best decisions come from combining clear visuals with context, evidence, ethics, and common sense.