Editorial note: This article synthesizes current public product documentation and experimentation best practices from Mixpanel, PostHog, Statsig, Amplitude, Optimizely, VWO, LaunchDarkly, and academic A/B testing research. The content is fully rewritten for original web publication.
Introduction: Why Mixpanel A/B Testing Matters
Mixpanel has long been known as a product analytics platformthe place teams go when they want to know what users actually do inside a web app, mobile app, or SaaS product. It tracks events, funnels, retention, cohorts, user journeys, and all those delicious behavioral breadcrumbs that tell product managers whether users are thriving, struggling, or rage-clicking like they are trying to start a campfire.
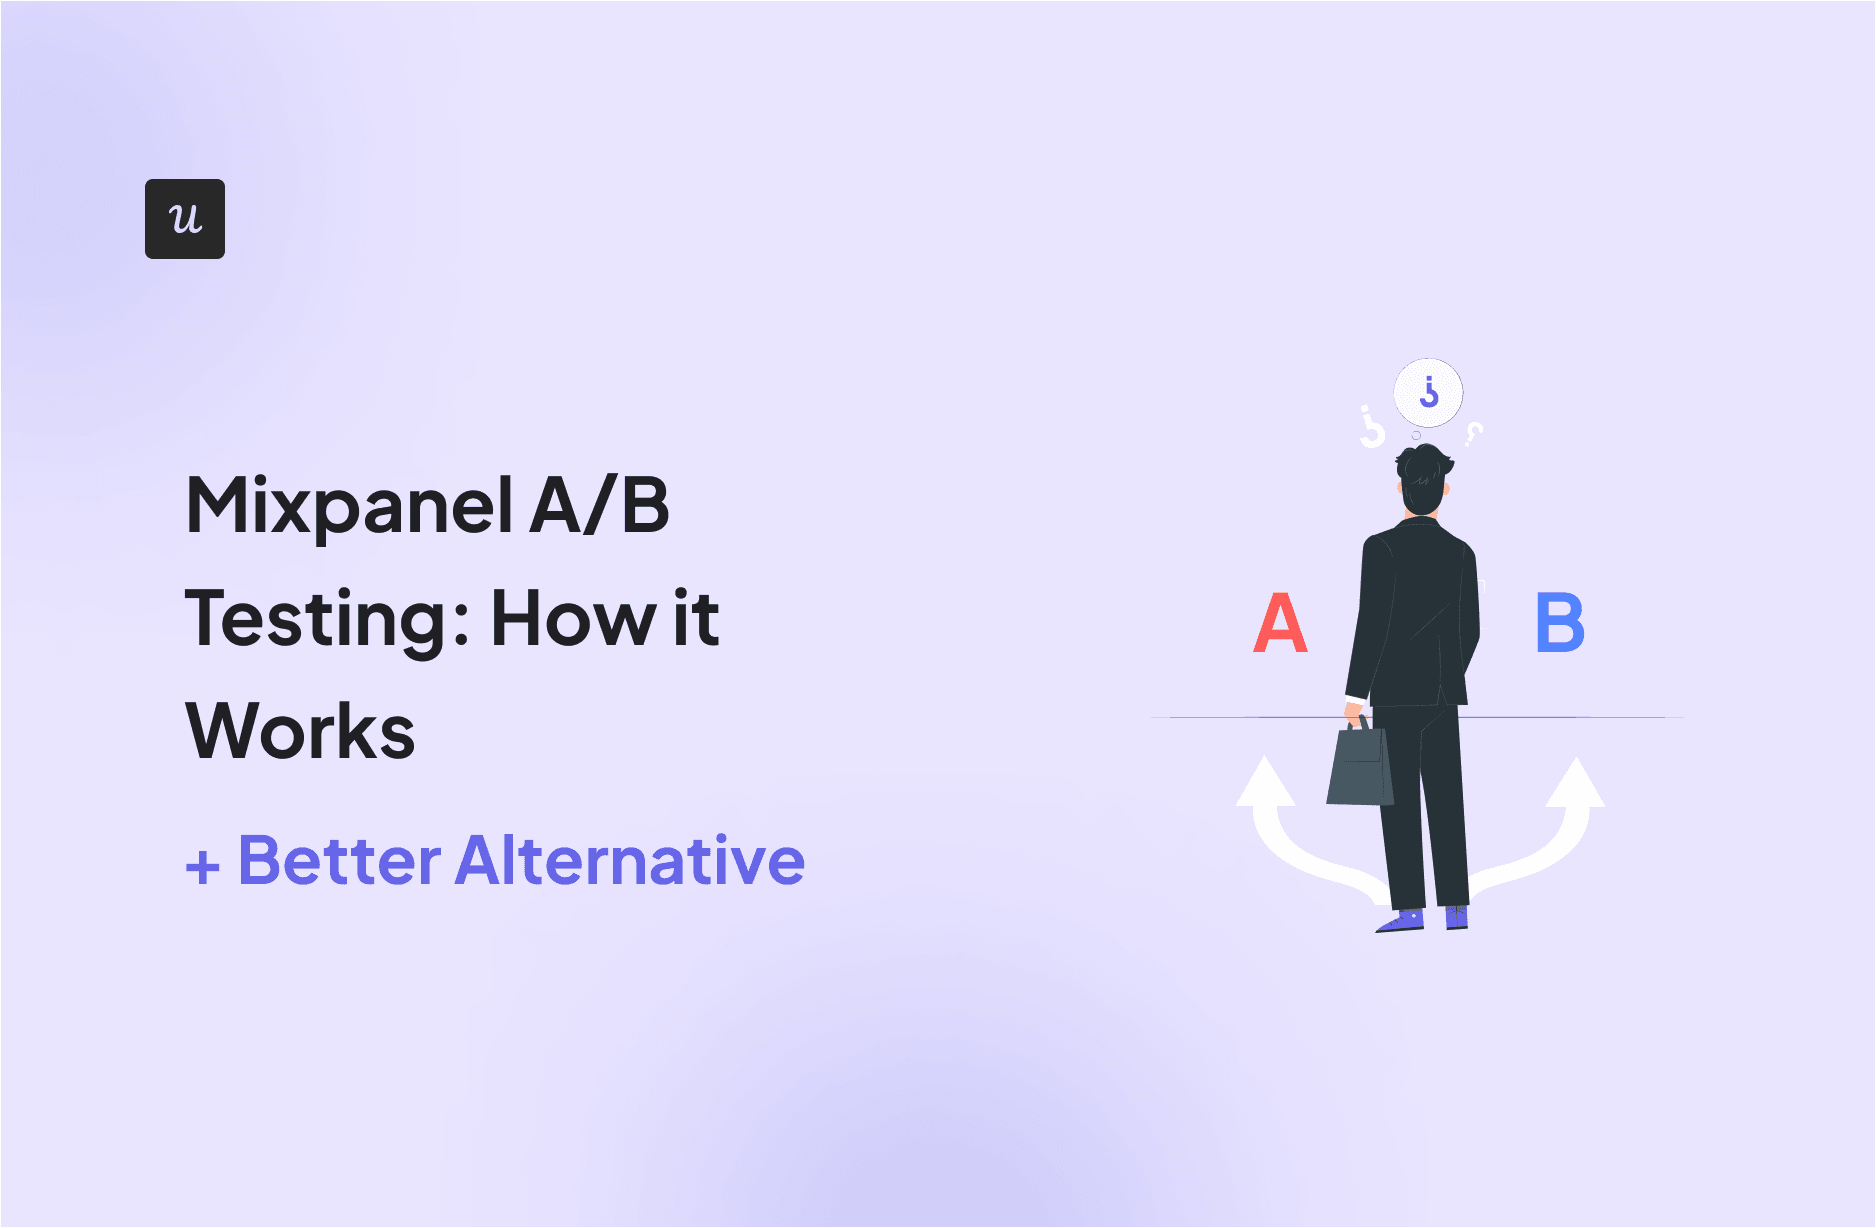
But analytics alone does not answer the most important product question: “What should we change next?” That is where A/B testing enters the chat. A/B testing compares two or more versions of a product experience and measures which version performs better against a defined goal. Instead of arguing in a meeting about whether the green button or blue button “feels more trustworthy,” teams can run an experiment and let user behavior settle the debate like a tiny democratic election for pixels.
Mixpanel A/B testing has evolved. Today, Mixpanel supports experimentation through feature flags and its Experiments reporting workflow, allowing teams to connect experiment exposure with product metrics. Still, it is not always the best fit for every company. Some teams need a lightweight analytics-first tool. Others need a dedicated experimentation platform with advanced statistics, governance, developer workflows, and feature release controls. This guide explains how Mixpanel A/B testing works, where it shines, where it gets awkward, and which alternative may be better for serious experimentation programs.
What Is Mixpanel A/B Testing?
Mixpanel A/B testing is the process of using Mixpanel to measure how different product variants affect user behavior. In simple terms, you show one group of users version A, another group version B, and then compare outcomes such as activation, trial conversion, retention, revenue, engagement, or feature adoption.
In a basic setup, Mixpanel is used as the analytics layer. Your product or experimentation tool assigns users to variants, and Mixpanel tracks which variant each user experienced. Then you analyze whether users in one group converted, retained, clicked, upgraded, or completed a funnel more often than users in another group.
In a more modern setup, Mixpanel can also play a bigger role through feature flags and Experiments. Feature flags control who sees which version of a feature, while Experiments help measure impact with statistical rigor. In other words, flags help you ship safely; experiments help you decide wisely. Think of feature flags as the steering wheel and experiments as the dashboard telling you whether you are driving toward product growth or straight into a ditch wearing sunglasses.
How Mixpanel A/B Testing Works
1. Define the Experiment Hypothesis
Every good A/B test starts with a hypothesis. A weak hypothesis sounds like, “Let’s change the onboarding page and see what happens.” That is not a strategy; that is product astrology.
A strong hypothesis is specific: “If we shorten the onboarding checklist from six steps to three, then new users will complete activation at a higher rate because they will experience less setup friction.” This gives your team a clear change, a target audience, a measurable outcome, and a reason the test should work.
2. Choose the Audience
Next, you decide who should enter the experiment. For example, you may test only new trial users, users on a free plan, mobile app users, accounts with fewer than five seats, or customers from a specific region. Audience selection matters because including the wrong users can muddy your results.
If your experiment only affects first-time users, do not include power users who have already memorized your product like a favorite sandwich order. Their behavior will not reflect the change you are testing.
3. Create Variants
Most A/B tests include a control and one treatment. The control is the current experience. The treatment is the new version. Some teams run A/B/n tests with multiple variants, such as three onboarding flows or four pricing page layouts.
In Mixpanel, variants can be served through Mixpanel feature flags or through another experimentation or feature flagging system. The key requirement is that Mixpanel must receive clean data showing which user saw which variant.
4. Track Exposure Events
Exposure tracking is one of the most important parts of experimentation. A user should count in the test only after they have actually been exposed to the experiment. If someone is assigned to variant B but never visits the screen where variant B appears, including them in the analysis can distort results.
A typical exposure event might include properties such as experiment name, variant name, user ID, device type, account plan, and timestamp. Clean exposure data is the difference between a trustworthy experiment and a spreadsheet wearing a fake mustache.
5. Select Primary, Secondary, and Guardrail Metrics
The primary metric is the main outcome used to judge success. For a SaaS onboarding experiment, that might be “completed activation.” For an ecommerce checkout test, it might be “purchase completed.” For a product-led growth company, it could be “started trial,” “invited teammate,” or “upgraded to paid plan.”
Secondary metrics provide context. Guardrail metrics help ensure the winning variant does not create hidden damage. For example, a new popup might increase demo requests but also increase churn, support tickets, or page exits. Congratulations, you got more leads and also annoyed everyone. Guardrail metrics keep teams honest.
6. Run the Experiment Long Enough
A/B testing should not be stopped just because a dashboard looks exciting after one afternoon. Early results can swing wildly, especially with small sample sizes. Teams should estimate sample size before launch, define test duration, and avoid peeking at results every ten minutes like a nervous parent checking a baby monitor.
Good experimentation requires enough users, enough conversions, and enough time to reduce randomness. If your product has low traffic, you may need to test bigger changes or use directional evidence rather than expecting statistical fireworks from a tiny sample.
7. Analyze Results in Mixpanel
Once data is collected, Mixpanel can help analyze how each variant affects funnels, retention, user paths, cohorts, and key product metrics. With the Experiments report, teams can compare variant performance against selected metrics and use statistical methods such as CUPED, which can reduce variance by accounting for pre-experiment user behavior.
This is where Mixpanel becomes especially useful for product teams. You are not limited to “Did this button get more clicks?” You can ask better questions: Did users activate faster? Did they come back next week? Did they explore more features? Did they invite teammates? Did they upgrade? Did they quietly disappear into the churn fog?
Mixpanel A/B Testing Example
Imagine a SaaS company wants to improve trial activation. The product team suspects that the current onboarding flow asks too much too soon. Users sign up, see six setup steps, sigh deeply, and begin questioning their life choices.
The team creates two variants:
- Control: The existing six-step onboarding checklist.
- Variant B: A simplified three-step checklist focused only on the actions most correlated with activation.
The team defines its primary metric as “activation completed within seven days.” Secondary metrics include “first key action completed,” “time to activation,” and “team invite sent.” Guardrail metrics include “support ticket submitted,” “onboarding skipped,” and “trial canceled.”
Users are randomly assigned to control or variant B. Mixpanel tracks experiment exposure, onboarding events, activation events, and downstream product behavior. After enough data is collected, the team compares results. If variant B improves activation without hurting retention or support burden, the team can roll it out more broadly. If it improves activation but lowers long-term retention, the team may have created a sugar rush instead of a healthy product habit.
Pros of Using Mixpanel for A/B Testing
Deep Product Analytics
Mixpanel’s biggest strength is behavioral analysis. It helps teams understand how users move through a product, where they drop off, which cohorts retain, and which actions correlate with growth. For A/B testing, this means you can analyze impact beyond surface-level conversion rates.
Funnels, Cohorts, and Retention Reports
Mixpanel makes it easier to evaluate experiments across funnels and user segments. You can see whether a variant works better for new users, power users, mobile users, or enterprise accounts. This matters because the “winning” experience for one group may be the “please never show me this again” experience for another.
Feature Flags and Experiment Analysis
Mixpanel’s feature flag capabilities support controlled rollouts, audience targeting, kill switches, and variants for A/B/x tests. When paired with Experiments, teams can connect release control with measurement.
Useful for Product-Led Teams
If your growth depends on activation, engagement, retention, and in-product conversion, Mixpanel can be a strong analytics layer for experimentation. It is especially helpful when product managers, growth teams, and analysts need to explore user behavior without writing SQL for every question.
Cons and Limitations of Mixpanel A/B Testing
Experimentation May Require Higher-Tier Access
Mixpanel’s public documentation describes the Experiment Report as a separately priced add-on currently offered on the Enterprise plan, with limited experiment creation available for customers who have not purchased the add-on. That means smaller teams may find full experimentation workflows less accessible than basic analytics features.
Not Always a Dedicated Experimentation System
Mixpanel is excellent at product analytics, but teams with mature experimentation programs may need more advanced controls: experiment governance, sequential testing, automated diagnostics, feature flag lifecycle management, advanced allocation, warehouse-native workflows, and deep engineering controls.
Setup Still Requires Discipline
Mixpanel will not magically fix poor event naming, missing exposure tracking, messy user IDs, or unclear metrics. If your data taxonomy looks like a raccoon organized it during a thunderstorm, your experiment results will suffer.
Tool Sprawl Can Happen
Some teams use Mixpanel for analytics, LaunchDarkly for feature flags, Optimizely or VWO for web testing, and a data warehouse for reporting. This can work, but it can also create conflicting numbers, duplicated setup, and meetings where everyone asks, “Wait, which dashboard is correct?” Nobody enjoys that meeting. Nobody.
Best Practices for Mixpanel A/B Testing
Use One Clear Primary Metric
Pick one main success metric before launching the test. Multiple metrics are useful, but if every metric is a winner metric, the experiment becomes a buffet of convenient interpretations.
Track Experiment Exposure Properly
Do not rely only on assignment. Track when users actually see or experience the variant. This keeps your analysis focused on affected users.
Segment Results Carefully
Segmenting results can reveal valuable patterns, but do not slice the data into tiny groups until you “discover” a win among left-handed tablet users in Ohio who logged in during a full moon. Use segmentation to understand real differences, not to hunt for accidental trophies.
Use Guardrail Metrics
Every experiment should have safety checks. If a variant increases clicks but hurts retention, performance, revenue quality, or customer satisfaction, it may not be a true win.
Document the Decision
Record the hypothesis, setup, metrics, sample size, results, and final decision. This creates an experimentation memory bank. Without documentation, your team will retest the same idea six months later and act surprised. Product teams are smart, but collective memory is often a goldfish with a laptop.
Better Alternative to Mixpanel A/B Testing: Statsig
For teams that treat experimentation as a core product development practice, Statsig is often a better alternative to Mixpanel A/B testing. While Mixpanel is strongest as a product analytics platform with experimentation capabilities, Statsig is built around experimentation, feature flags, product analytics, session replay, and release measurement in one system.
Statsig is especially compelling for engineering-led and data-driven product teams that want every feature launch to be measurable. It supports feature gates, experiments, rollout controls, analytics, and advanced statistical workflows. Instead of using one tool to ship variants and another to analyze behavior, teams can manage the full experimentation lifecycle in a more unified environment.
Why Statsig Can Be Better
First, experimentation is central. Statsig is designed for teams running frequent experiments, not just occasional A/B tests. That matters when experimentation moves from “growth team side quest” to “how product decisions get made.”
Second, it offers strong feature flagging. Feature flags allow teams to launch gradually, target specific audiences, turn features off quickly, and connect releases with measurable outcomes. This reduces risk and makes product shipping feel less like tossing a toaster into a bathtub and hoping for innovation.
Third, it is built for technical teams. Statsig is a strong fit for companies that need SDKs, server-side experimentation, advanced targeting, reliable assignment, and analytics tied directly to releases.
Fourth, it supports mature experimentation practices. Teams running many tests need more than a chart. They need trustworthy metrics, diagnostics, governance, and workflows that help avoid false positives, sample ratio issues, and messy decision-making.
When Mixpanel Is Still the Better Choice
Mixpanel may be the better choice if your main need is product analytics and you only run experiments occasionally. It is also a good fit if your team values fast self-serve analysis, funnels, cohorts, retention reports, and behavioral exploration more than advanced experimentation infrastructure.
When Statsig Is the Better Choice
Statsig is the better choice if your team wants experimentation, feature flags, analytics, and release measurement tightly connected. It is especially useful for companies that ship frequently, run many product experiments, need engineering-friendly controls, or want to turn feature releases into measurable learning loops.
Mixpanel vs Statsig: Quick Comparison
| Category | Mixpanel | Statsig |
|---|---|---|
| Primary Strength | Product analytics and behavioral insights | Experimentation, feature flags, and release measurement |
| A/B Testing | Available through Experiments and/or integrations | Core platform capability |
| Feature Flags | Supports rollouts, targeting, kill switches, and variants | Strong feature flagging with experimentation workflows |
| Best For | Teams focused on analytics, funnels, retention, and cohorts | Teams running frequent experiments and measured releases |
| Potential Limitation | Full experimentation access may depend on plan and add-ons | May be more tool than needed for analytics-only teams |
Other Mixpanel A/B Testing Alternatives
PostHog
PostHog is a strong alternative for teams that want product analytics, feature flags, experiments, session replay, surveys, and data warehouse support in one platform. It is especially attractive to developer-led teams and companies that value open-source flexibility or self-hosting options.
Amplitude Experiment
Amplitude is another major product analytics platform with experimentation capabilities. It can work well for larger teams that want analytics, feature experimentation, behavioral cohorts, and personalization workflows under one broader digital analytics platform.
Optimizely
Optimizely is a mature experimentation platform with web experimentation, feature experimentation, and enterprise optimization capabilities. It is often a fit for larger organizations with established CRO, product, and engineering experimentation programs.
LaunchDarkly
LaunchDarkly is best known for feature management and progressive delivery. Teams often pair it with analytics tools to understand the impact of releases. It is a strong option when release control and developer workflows are the top priority.
How to Choose the Right A/B Testing Tool
The best A/B testing tool depends on your team’s maturity, traffic volume, technical resources, and decision-making culture.
Choose Mixpanel if you want excellent product analytics and need to evaluate experiments against funnels, retention, and cohorts. Choose Statsig if experimentation is a core workflow and you want feature flags, release measurement, and statistical analysis in one system. Choose PostHog if you want an all-in-one, developer-friendly platform with analytics, experiments, session replay, and open-source flexibility. Choose Optimizely if your organization needs enterprise experimentation across marketing, product, and engineering. Choose LaunchDarkly if feature management and safe deployment are your top priorities.
Above all, choose a tool your team will actually use correctly. The fanciest experimentation platform in the world cannot save a vague hypothesis, broken event tracking, or a team that declares victory because one graph went up on Tuesday.
Real-World Experience: What Teams Learn After Running Mixpanel A/B Tests
After working with product analytics and A/B testing workflows, one lesson becomes obvious very quickly: the hard part is rarely creating the variant. The hard part is deciding what the variant is supposed to prove. Many teams begin with a design preference disguised as a hypothesis. Someone wants a shorter signup form, a new dashboard layout, or a shinier upgrade banner. That is fine, but the experiment must connect the change to a measurable behavior. Otherwise, the test becomes decoration with math attached.
Mixpanel is useful because it pushes teams to think beyond clicks. A button click may look like a win, but the real question is whether that click leads to activation, retention, expansion, or revenue. In one common SaaS scenario, a team may test a more aggressive upgrade prompt. The prompt increases clicks to the pricing page, which looks great at first. But Mixpanel funnel and retention analysis may reveal that users exposed to the prompt complete fewer core actions and return less often. The short-term number smiles; the long-term product health frowns. That is why downstream metrics matter.
Another practical lesson is that event naming discipline saves everyone from chaos. Before running experiments in Mixpanel, teams should agree on event names, user properties, account properties, and exposure tracking rules. If one engineer sends “experiment_viewed,” another sends “Experiment Seen,” and a third sends “ab_test_loaded_final_final_v2,” the analysis will become a detective story nobody wanted to read.
Teams also learn that A/B testing is not only for landing pages. In product-led SaaS, some of the best tests happen inside the product: onboarding checklists, empty states, upgrade prompts, invite flows, search experiences, notification settings, AI assistant entry points, dashboard defaults, and feature discovery patterns. These are the moments where users decide whether the product is useful, confusing, or secretly designed by a committee of caffeinated squirrels.
Mixpanel works well when the team already trusts it as the source of behavioral truth. Product managers can inspect funnels, analysts can validate cohorts, and growth teams can evaluate whether a test changed meaningful behavior. However, as experimentation volume increases, the workflow can become more demanding. Teams may need stronger experiment governance, more advanced statistical controls, and tighter integration between feature rollout and analysis. That is when a platform like Statsig can become attractive.
The biggest experience-based recommendation is this: do not run A/B tests just to look data-driven. Run them when the result will change a decision. If your team will launch the new version no matter what the data says, do not call it an experiment. Call it a rollout and save everyone the statistical theater. A good experiment has a clear decision attached: ship, stop, iterate, segment, or investigate further.
Finally, the best experimentation cultures treat losing tests as useful information. A failed test is not a personal insult from the universe. It is evidence. It tells you what users did not value, which assumption was weak, or where your product mental model needs updating. In that sense, Mixpanel A/B testing is not just about finding winners. It is about building a learning system where every release teaches the team something useful.
Conclusion
Mixpanel A/B testing can be powerful when teams want to connect product experiments with real user behavior. Its strengths are behavioral analytics, funnels, cohorts, retention analysis, and the ability to understand what happens after users see a variant. With feature flags and Experiments, Mixpanel can support a more complete experimentation workflow than it could in the past.
However, Mixpanel is not automatically the best A/B testing platform for every team. If your company only needs occasional experiment analysis, Mixpanel may be enough. If your company runs frequent tests, ships behind feature flags, and wants experimentation at the center of product development, Statsig is a stronger alternative. The right choice depends on whether your team needs analytics with experimentation attached, or experimentation built into the heart of the product development process.
The bottom line: Mixpanel helps you understand user behavior. A dedicated experimentation platform helps you turn product changes into reliable decisions. The best teams use both the science and the common sense. And yes, they also stop arguing about button colors. Eventually.