Is the frequency domain a real place? Not in the way your kitchen, your school, or that suspiciously sticky movie theater floor is a real place. You cannot pack a suitcase, book a flight, and arrive at Gate 12B in the frequency domain. There are no hotels, no traffic, and no tiny gift shop selling “I survived the Fourier transform” mugs. But if you work with sound, radio, images, vibration, medical scanners, electrical circuits, or data science, the frequency domain starts to feel very real indeed.
The short answer is this: the frequency domain is not a physical location. It is a mathematical way of describing signals by their frequencies instead of by their behavior over time. Yet calling it “just math” undersells it. The frequency domain is one of the most useful maps humans have ever invented for understanding waves, patterns, noise, and hidden structure. It is not a place you stand in; it is a place your data can be represented.
Think of it like switching from a street view to a subway map. The subway map does not show buildings, trees, or hot dog carts, but it reveals something street view may hide: how the system is connected. The frequency domain does the same for signals. It strips away the time-by-time wiggle and asks, “What ingredients are making this wiggle happen?”
What Is the Frequency Domain?
The frequency domain is a way of looking at a signal based on how much of each frequency it contains. A signal might be a sound wave, a radio transmission, a vibration from a machine, a heartbeat measurement, an image, or a stream of sensor data. In the time domain, we watch the signal change moment by moment. In the frequency domain, we ask which repeating patterns are inside it.
Frequency means how often something repeats per unit of time. One cycle per second is one hertz. A bass note vibrates at a relatively low frequency. A whistle sits at a higher frequency. A Wi-Fi signal operates at radio frequencies far beyond what human ears can hear. The frequency domain gives engineers, scientists, and analysts a way to sort all those repeating behaviors into a useful spectrum.
If the time domain is a video of a drummer playing, the frequency domain is the audio engineer saying, “The kick drum is heavy around here, the snare is bright over there, and someone needs to calm down that cymbal before it files a noise complaint.”
Time Domain vs. Frequency Domain: Two Views of the Same Reality
The time domain shows how a signal changes over time. If you record your voice and display the waveform, you are looking at pressure changes over milliseconds. It is direct and intuitive: louder parts look bigger, quieter parts look smaller, and sudden sounds create sharp changes.
The frequency domain shows the same signal from another angle. Instead of asking, “What happened at this instant?” it asks, “What frequencies are present, and how strong are they?” That is why it is so useful. Many things that look messy in time become organized in frequency.
A Simple Example: A Musical Chord
Imagine playing three piano notes at once. In the time domain, the resulting waveform looks like a complicated squiggle. Unless you are a very unusual person who reads waveforms like bedtime stories, it is not obvious which notes are inside. In the frequency domain, the same chord appears as peaks at the frequencies of the notes. Suddenly the musical ingredients are visible.
This is the magic trick, except it is not magic. It is mathematics wearing a cape. The frequency domain reveals structure that the time domain can hide.
The Fourier Transform: The Portal, Not the Place
The main tool for moving between the time domain and the frequency domain is the Fourier transform. It takes a signal described over time and represents it as a combination of sinusoids: smooth waves with different frequencies, amplitudes, and phases.
In plain English, the Fourier transform says: “Give me your complicated signal, and I will tell you what waves it is made of.” The inverse Fourier transform does the reverse: it takes the frequency ingredients and reconstructs the original signal. That two-way relationship is why the frequency domain is so powerful. It is not a fantasy sketch. It is a mathematically precise representation of the same information.
The Fast Fourier Transform, or FFT, is a highly efficient algorithm for computing frequency information from sampled data. Without the FFT, modern signal processing would be much slower and much grumpier. The FFT is used in audio software, spectrum analyzers, radar systems, wireless communications, vibration testing, image processing, and scientific instruments. It is one of those invisible technologies quietly making the modern world behave.
So, Is the Frequency Domain Real?
The honest answer is: it depends on what you mean by “real.” If you mean physically real, like a room with walls, no. The frequency domain is not floating behind the refrigerator. If you mean scientifically real, operationally useful, and deeply connected to measurable phenomena, yes. It is very real.
A map is not the territory, but a good map can help you cross a mountain. The frequency domain is a map. It does not replace the physical signal, but it describes the signal in a way that often makes problems easier to solve.
For example, a noisy recording may look hopeless in the time domain. In the frequency domain, the noise might appear as a narrow spike at 60 Hz, caused by electrical hum. Remove or reduce that frequency band, and the recording becomes cleaner. Did the engineer travel to the frequency domain with a tiny broom? No. But the frequency-domain representation made the solution visible.
Why Engineers Love the Frequency Domain
Engineers use the frequency domain because many systems respond differently to different frequencies. Speakers, microphones, bridges, circuits, antennas, filters, and mechanical structures all have frequency-dependent behavior. A system may pass low frequencies, block high frequencies, resonate at one frequency, or distort another.
This matters because real-world systems are rarely polite. They vibrate, echo, amplify, attenuate, interfere, and occasionally behave like they have had too much coffee. The frequency domain helps people understand what is happening and design better systems.
Audio Equalizers
An audio equalizer is one of the easiest ways to experience the frequency domain. When you boost bass, cut mids, or brighten treble, you are changing the strength of certain frequency ranges. The song still plays over time, but your adjustments are frequency-based. You are not editing every moment one by one. You are shaping the spectrum.
Wireless Communication
Wireless systems rely heavily on frequency-domain thinking. Radio stations, cellular networks, Bluetooth devices, Wi-Fi routers, and satellites all use frequency bands. Without frequency organization, the airwaves would become a chaotic soup of signals yelling over each other like people trying to order tacos during a fire drill.
Vibration Analysis
Machines often reveal problems through vibration. A motor with a worn bearing may produce unusual frequency components. In the time domain, the vibration signal may look like general shaking. In the frequency domain, a technician can often identify specific peaks linked to rotating parts, imbalance, looseness, or wear. The frequency domain becomes a diagnostic flashlight.
Images Have Frequencies Too
Frequency is not only about sound. Images also have frequency content. In image processing, low spatial frequencies represent broad, smooth changes, such as gradual shading or large shapes. High spatial frequencies represent sharp edges, fine details, and texture.
This is why frequency-domain methods show up in image compression, sharpening, denoising, and medical imaging. A blurry image has lost some high-frequency detail. A heavily compressed image may show artifacts because certain frequency information was reduced or approximated. The image still looks like pixels on a screen, but its hidden structure can be understood through frequency.
Medical imaging systems also use frequency-based concepts. MRI data, for instance, is often discussed in terms of spatial frequency information before it becomes the image a doctor reads. Again, nobody is wandering through a physical “frequency place,” but the representation is essential to making the final picture.
Phase: The Detail Everyone Forgets Until It Breaks Something
When people first learn about the frequency domain, they often focus on amplitude: how much of each frequency exists. That is important, but it is not the whole story. Phase also matters. Phase describes where each sinusoidal component lines up in its cycle.
Two signals can have the same frequency magnitudes but different phases, and they may look very different in the time domain. Phase is especially important in communications, audio, control systems, imaging, and any situation where timing relationships matter. Ignoring phase is like reading a recipe with all the ingredients but none of the instructions. You might still make dinner, but dinner may file a complaint.
When the Frequency Domain Becomes Misleading
The frequency domain is powerful, but it is not magic dust. It has limitations. A basic Fourier transform tells you what frequencies are present across a signal, but it does not always tell you exactly when those frequencies occur. If a signal changes over time, a simple frequency spectrum may blur together events that happened at different moments.
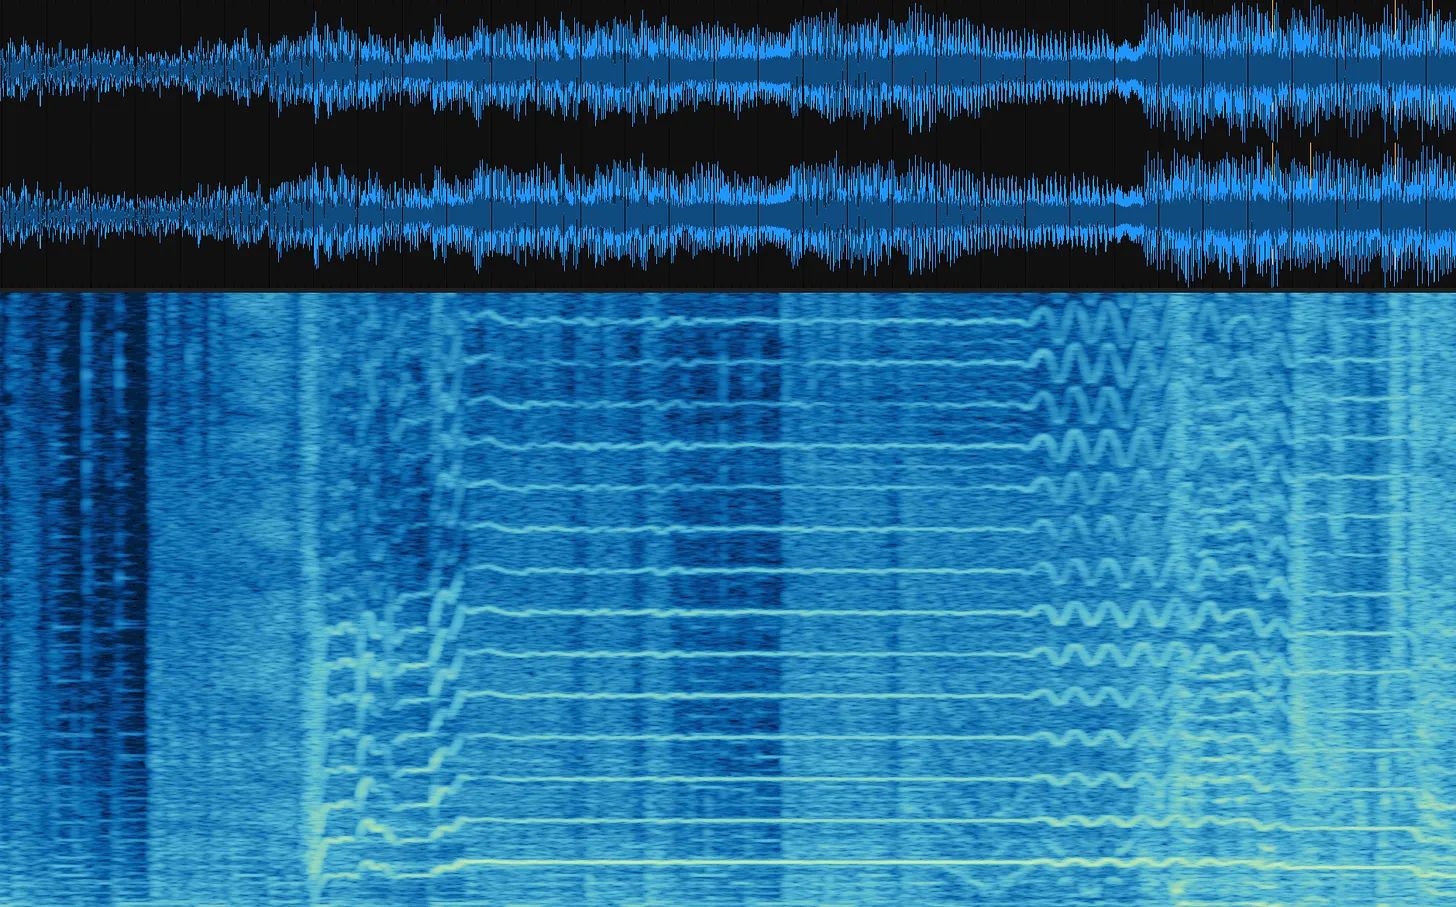
That is why engineers use time-frequency methods, such as spectrograms and short-time Fourier transforms. These tools show how frequency content changes over time. A spectrogram is common in audio analysis, speech processing, music production, seismology, radar, and biological signal analysis. It is like giving the frequency domain a calendar.
Sampling also matters. Digital systems measure signals at discrete intervals. If the sampling rate is too low, high-frequency information can masquerade as lower-frequency information. This problem is called aliasing. It is the signal-processing version of seeing wagon wheels appear to spin backward in a video. The wheel did not suddenly become rebellious; the sampling created a misleading view.
Is Frequency More Fundamental Than Time?
This is where the question becomes philosophical. Is the frequency domain simply a convenient calculation, or does it reveal something deeper about reality?
Physics gives us reasons to take frequency seriously. Waves are central to sound, light, quantum mechanics, electromagnetism, and vibration. Many physical systems naturally oscillate. Resonance, energy levels, color, pitch, and wave propagation all involve frequency. In that sense, frequency is not an artificial idea humans randomly invented during a rainy afternoon. It describes real patterns in nature.
At the same time, time-domain and frequency-domain descriptions are often complementary. One is not necessarily “more real” than the other. They are different coordinate systems for the same underlying phenomenon. Saying the frequency domain is fake because it is mathematical is like saying latitude and longitude are fake because the equator is not painted on the ground. Please do not try to paint it. The paperwork would be terrible.
Practical Examples That Make the Frequency Domain Feel Real
Removing Hum From Audio
Electrical systems often introduce hum at specific frequencies. In the United States, power-line hum is commonly associated with 60 Hz and its harmonics. A recording engineer can inspect the spectrum, identify the hum, and reduce it with a notch filter. The time-domain waveform may not clearly reveal the source, but the frequency domain points directly at the culprit.
Finding Faults in Rotating Machinery
A factory motor may vibrate at frequencies related to its rotation speed, bearing geometry, or gear teeth. By measuring vibration and studying the frequency spectrum, maintenance teams can catch problems before a machine fails. This is not theoretical daydreaming. It saves money, prevents downtime, and keeps machinery from making the expensive sound known as “clunk.”
Designing Filters
Filters are often designed in terms of frequency response. A low-pass filter allows low frequencies to pass while reducing high frequencies. A high-pass filter does the opposite. Band-pass filters allow a selected range. These designs are used in audio equipment, sensors, communications, medical devices, and control systems.
Understanding Speech
Speech contains changing frequency patterns. Vowels, consonants, pitch, and timbre all have spectral signatures. Speech recognition, hearing aids, voice compression, and audio enhancement often depend on frequency-domain analysis. Your phone does not understand your voice because it has feelings. It understands patterns, and many of those patterns live comfortably in frequency representations.
The Frequency Domain in Everyday Life
You may not think about the frequency domain when you stream music, join a video call, scan a QR code, use noise cancellation, connect to Wi-Fi, take a medical scan, or watch a compressed video online. But frequency-domain ideas are working behind the scenes.
Noise-canceling headphones analyze sound and generate opposing signals. Music apps compress audio by taking advantage of how humans perceive frequencies. Image and video compression systems reduce data while trying to preserve what viewers notice most. Wireless devices share limited spectrum. Scientific instruments use spectral analysis to detect patterns too subtle for direct inspection.
The frequency domain is not a place, but modern life keeps sending postcards from it.
Common Misconceptions About the Frequency Domain
Misconception 1: The Frequency Domain Is Only for Engineers
Engineers use it heavily, but the concept reaches far beyond engineering. Musicians, data scientists, physicists, neuroscientists, astronomers, medical imaging specialists, economists, and software developers all use frequency-based thinking in different ways.
Misconception 2: Frequency Analysis Destroys Time Information
A full Fourier representation can contain enough information to reconstruct the original signal, assuming the mathematical conditions and data handling are appropriate. However, certain simplified displays, such as magnitude-only spectra, may leave out phase or timing details. The representation is not automatically incomplete; the way people display or process it may be.
Misconception 3: A Spectrum Is the Signal
A spectrum is a representation of the signal, not a separate physical object. It is like a recipe, fingerprint, or blueprint. It can be incredibly informative, but it is not the original event itself.
Experience Section: Learning to Trust the Invisible Map
The first time many people meet the frequency domain, it feels suspicious. In the time domain, a signal looks like something. It wiggles across a graph. It has a beginning, middle, and end. You can point to a spike and say, “There. Something happened.” The frequency domain asks you to stop watching the action and instead examine the ingredients. That can feel like being told to understand a movie by sorting its colors. Useful? Maybe. Weird? Absolutely.
One relatable experience comes from audio editing. Suppose you record a voiceover in a room that seemed quiet. Then you play it back and hear a low buzz. In the time-domain waveform, the buzz may hide inside the voice. It is there, but it does not politely wave. Open a spectrum analyzer, however, and suddenly a narrow peak appears. That peak says, “Hello, I am your unwanted hum, and I have been living rent-free in your recording.” Once you see it, filtering becomes much easier. The frequency domain turns a vague annoyance into a specific target.
Another common experience appears in music production. A beginner may try to make every instrument louder because louder feels better for about twelve seconds. Then the mix becomes muddy. The bass fights the kick drum. The vocal disappears. The guitar takes up too much space. Looking at the frequency ranges helps explain why. Instruments can overlap in the spectrum even when they play different notes. By carving small spaces with EQ, the mix becomes clearer. The frequency domain becomes less like abstract math and more like seating arrangements at a dinner party where the cymbals should not sit next to everyone.
There is also a learning experience in vibration and mechanical problems. A fan, laptop, bicycle wheel, or washing machine can make a repeating noise that feels hard to describe. In ordinary language, we say it rattles, hums, whines, or makes “that sound again.” Frequency analysis gives that sound a number. Once the dominant frequency is known, it may connect to rotation speed, imbalance, looseness, or resonance. The invisible pattern becomes measurable. The machine has not changed, but your view of it has.
Students often experience the same shift when they first use an FFT on a signal made from two sine waves. In the time domain, the combined wave looks complicated. In the frequency domain, two clean peaks appear. That moment is oddly satisfying, like finding out a messy drawer contains only socks and one dramatic scarf. The signal was not random. It was structured. You simply needed the right view.
The biggest lesson from working with the frequency domain is humility. Our senses are time-domain creatures. We hear sounds unfold, watch events happen, and feel vibrations as they arrive. But reality often contains patterns that are easier to understand when reorganized. The frequency domain teaches that “real” does not always mean “directly visible.” Sometimes real means measurable, reversible, predictive, and useful. That is a pretty strong résumé for a place that does not technically exist.
Conclusion: A Real Place? No. A Real Tool? Absolutely.
So, is the frequency domain a real place? No, not physically. You cannot visit it, rent an apartment there, or lose your keys in it. But it is a real mathematical domain, a real engineering tool, and a real way to understand the structure of signals. It helps reveal patterns that are difficult or impossible to see in the time domain alone.
The frequency domain matters because the world is full of waves, cycles, vibrations, rhythms, and repeated patterns. From music and Wi-Fi to medical imaging and machine diagnostics, frequency-domain analysis gives us a cleaner, sharper way to understand complicated signals. It is not a separate universe. It is a different lens on this one.
And sometimes, a better lens is exactly what reality needs.