Wildfire maps have a way of looking dramatic even before you read the numbers. A few red blotches in the West, a smoky smudge across Alaska, a surprising hot spot in the Southern Plains, and suddenly the United States looks like somebody let a campfire borrow the family car. But behind every dot on a wildfire map is land: forest, grassland, rangeland, desert scrub, farms, parks, tribal land, neighborhoods, and wildlife habitat.
So, which states are losing the most land to wildfires? The short answer is that the map changes from year to year, but the same broad regions keep showing up: Alaska, California, the Pacific Northwest, the Mountain West, the Southwest, and parts of the Southern Plains. The latest complete federal annual wildfire data shows Alaska far ahead in total burned acreage, followed by California, Arizona, Oregon, Oklahoma, Colorado, Nevada, Washington, Florida, and Idaho.
Data note: In this article, “land lost” means acres burned by wildfires during the reporting year. Burned land is not always permanently destroyed. Many landscapes recover, some forests regenerate, and some ecosystems are fire-adapted. Still, burned acreage is a powerful way to understand where wildfire pressure is hitting hardest.
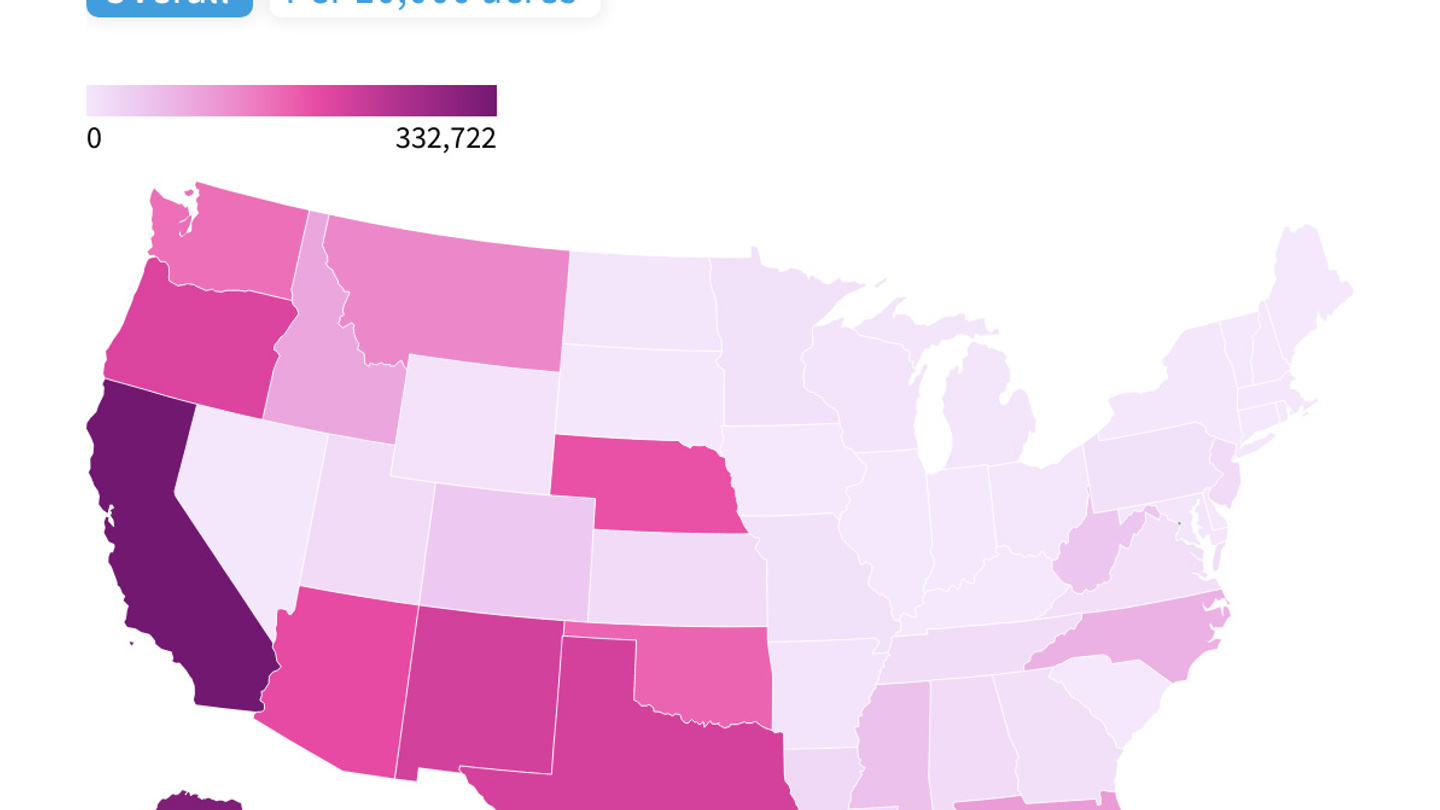
Mapped: The States Losing the Most Land to Wildfires
If the wildfire map were a heat map, Alaska would be glowing like a porch light in mosquito season. In the latest full-year federal wildfire reporting, Alaska recorded more than one million acres burned. That number is enormous, but it also needs context: Alaska is vast, remote, and full of boreal forests where lightning can ignite fires that spread across huge areas with limited direct threat to homes.
California, meanwhile, ranks high for a very different reason. The state combines dry summers, rugged terrain, dense vegetation, powerful wind events, and millions of people living near flammable landscapes. A California fire does not need to be the biggest in the country to become the most expensive, destructive, or terrifying. When flames meet subdivisions, highways, power lines, and evacuation routes, the acreage number tells only part of the story.
Top States by Wildfire Acres Burned
| Rank | State | Acres Burned | What the Map Shows |
|---|---|---|---|
| 1 | Alaska | 1,006,158 | Large boreal fires, many sparked by lightning, often in remote regions. |
| 2 | California | 505,994 | High-risk mix of forests, chaparral, wind, drought, and dense development. |
| 3 | Arizona | 326,813 | Southwestern heat, dry fuels, lightning, and desert-to-forest terrain. |
| 4 | Oregon | 324,601 | Forest and rangeland fires across the Cascades, eastern Oregon, and dry valleys. |
| 5 | Oklahoma | 304,179 | Wind-driven grassland fires that can move with shocking speed. |
| 6 | Colorado | 255,968 | Mountain forests, dry lightning, steep terrain, and expanding communities. |
| 7 | Nevada | 250,804 | Rangeland and desert shrub fires, often helped by dry grasses and wind. |
| 8 | Washington | 247,066 | Dry east-side forests, lightning outbreaks, and summer heat waves. |
| 9 | Florida | 233,642 | Frequent fire in pine, swamp, grass, and scrub landscapes during dry periods. |
| 10 | Idaho | 180,935 | Mountain forests, backcountry fires, and dry summer lightning. |
Why Alaska Often Tops the Wildfire Acreage Map
Alaska is the heavyweight champion of wildfire acreage because it has three ingredients that produce big numbers: huge land area, vast boreal forests, and frequent lightning in summer. A fire in interior Alaska can burn for weeks or months through black spruce, tundra edges, and remote timber where suppression may be limited unless communities, infrastructure, or critical resources are threatened.
This is why Alaska can lead the nation in acres burned without dominating the evening news. Many fires there are far from population centers. That does not mean they are harmless. They can affect wildlife habitat, permafrost, carbon storage, air quality, and Indigenous communities. But the risk profile is different from a fast-moving fire in Los Angeles County or the foothills near Denver.
Think of Alaska’s wildfire problem as a giant slow cooker. California’s problem is sometimes a blowtorch near a housing development. Both are dangerous, but they burn differently, behave differently, and demand different strategies.
California: Fewer Acres Can Still Mean Bigger Damage
California remains one of the most important wildfire states on any map because acreage alone does not capture destruction. The state’s wildland-urban interface, where homes and flammable vegetation meet, creates high stakes. One wind-driven fire can burn fewer acres than a remote Alaska blaze but destroy far more homes, close highways, trigger mass evacuations, and send smoke into major metro areas.
California’s fire geography is almost unfairly complicated. Northern California has forests that can dry into giant fuel beds. Southern California has chaparral that burns fiercely, especially under Santa Ana winds. The Sierra Nevada carries heavy forest fuel loads in some areas, while coastal hills can turn into fire corridors when hot, dry winds arrive. Add power lines, roads, recreation, drought, and development, and you get a wildfire recipe with too many cooks and not enough firebreaks.
The Pacific Northwest Is No Longer a “Wet Side” Story
Oregon and Washington both rank high on the wildfire acreage map, and their position is one of the clearest signs that wildfire risk has expanded beyond old stereotypes. Yes, parts of the Pacific Northwest are famously rainy. Yes, moss grows like it pays rent. But east of the Cascades, summers are dry, grasses cure quickly, forests can become stressed, and lightning can ignite multiple fires in a single outbreak.
Oregon’s recent wildfire history shows how quickly a state can jump up the rankings. In bad years, large fires can sweep across rangeland and forest, threatening rural communities, ranches, recreation sites, power infrastructure, and timber resources. Washington faces similar pressures, especially in the dry eastern half of the state, where wind and terrain can quickly turn a manageable ignition into a regional emergency.
Why Oklahoma, Texas, and the Plains Keep Appearing
When people imagine wildfires, they often picture pine forests and mountain smoke. But grassland fires deserve more respect. Oklahoma, Texas, Kansas, Nebraska, and the wider Southern Plains can produce huge fires because grasses dry out, winds roar across open country, and flames can sprint faster than most people expect. Grassfire does not politely knock on the door. It arrives like it is late for a meeting.
In the Plains, the wildfire map is shaped by weather whiplash. Wet periods grow abundant grass. Then drought, heat, low humidity, and wind turn that grass into fuel. A single spark from equipment, vehicles, power lines, debris burning, or lightning can move across ranchland with frightening speed. These fires may not look like the towering forest infernos seen in the West, but they can burn massive acreage and threaten livestock, homes, fences, roads, and small towns.
The Southwest: Arizona and New Mexico Stay in the Danger Zone
Arizona and New Mexico sit in one of the country’s most fire-sensitive regions. Their wildfire risk is shaped by heat, drought, rugged terrain, lightning, dry grasses, forest fuel, and the timing of the North American monsoon. A delayed or weak monsoon can leave fuels ready to burn. A lightning storm with little rain can scatter ignitions across mountains, mesas, and desert edges.
Arizona’s high ranking reflects how quickly fires can grow in a state that includes desert scrub, ponderosa pine forests, canyon country, and remote public lands. New Mexico, while just outside the top 10 in the latest acreage ranking, remains a major wildfire state. Recent destructive fires in and around mountain communities have shown that the Southwest’s risk is not just about acres; it is about water supplies, post-fire flooding, cultural landscapes, and communities with limited evacuation routes.
What the Wildfire Map Really Measures
A wildfire acreage map measures area burned, but it does not measure every kind of loss. One million remote acres may have fewer destroyed structures than 10,000 acres burning through a town. A fire in grassland may recover faster visually than a severe forest fire that sterilizes soil, damages watersheds, and leaves slopes vulnerable to mudslides. A prescribed fire may add to burn totals in some datasets but reduce future disaster risk. Context matters.
That is why the best wildfire analysis uses several layers: acres burned, number of fires, fire severity, structures lost, smoke exposure, suppression costs, evacuation impacts, insurance pressure, ecological damage, and recovery time. The map is the first clue, not the full mystery novel.
Why Wildfire Acreage Keeps Shifting
Wildfire rankings change because fire depends on weather, fuel, ignition, and timing. A state can have a quiet year if spring rains arrive, lightning stays limited, and winds cooperate. The same state can explode up the chart the next year if winter snowpack is low, summer heat is persistent, grasses are abundant, and dry thunderstorms sweep through.
Climate change adds pressure by increasing heat, drying fuels, lengthening fire seasons in many regions, and raising the odds of extreme fire weather. Land management also matters. Some forests have accumulated heavy fuel loads after decades of fire exclusion. Invasive grasses can create continuous fuel beds in rangelands. Expanding development places more homes in places where fire has always been part of the landscape.
The result is a map that behaves less like a fixed ranking and more like a warning system. When Alaska leads, the story may be lightning and boreal forest. When Oregon or Idaho jumps, it may be a dry lightning outbreak. When Texas or Oklahoma surges, look for wind, drought, and grass. When California rises, watch for wind events, dry fuels, and human exposure.
Which States Face the Highest Future Wildfire Risk?
Looking only at burned acreage can make wildfire risk seem like a contest won by the biggest states. But future risk is more complicated. California, Oregon, Washington, Arizona, New Mexico, Colorado, Idaho, Montana, Nevada, Utah, Texas, and Florida all face serious wildfire challenges. Their risks differ by ecosystem, climate, population patterns, and preparedness.
Florida is a good example of a state that surprises some readers. It has frequent fires, fire-adapted ecosystems, and a long tradition of prescribed burning. The state’s wetlands, pine flatwoods, and scrub landscapes can burn during dry periods. Because so many people live near vegetation, even smaller fires can create smoke, road closures, and neighborhood threats.
Colorado is another example. It may not always lead in acres burned, but mountain communities, steep terrain, forests stressed by drought and insects, and fast-growing foothill development make wildfire a long-term planning issue. Nevada and Utah face major rangeland fire concerns, especially where invasive grasses help fires spread across open landscapes.
How Communities Can Read the Map and Respond
For homeowners, wildfire maps should not be treated like scary wallpaper. They are planning tools. If your state ranks high in burned acreage, it is worth checking local evacuation routes, defensible space guidance, insurance coverage, emergency alerts, and community fuel-reduction programs. If your state ranks low, do not get too comfortable. Wildfires have affected nearly every state, and risk can rise quickly during drought or wind events.
For local leaders, the map points toward practical questions. Where are the most vulnerable neighborhoods? Which roads would clog during evacuation? Are power lines, water systems, hospitals, and schools protected? Are prescribed burns, thinning, grazing, mowing, and home-hardening programs being used where they make sense? Can residents receive alerts in time?
The map is not just about where fire has been. It is about where preparation needs to go next.
Experience Notes: What Wildfire Acreage Feels Like on the Ground
Statistics can make wildfire sound abstract. “Three hundred thousand acres burned” is a headline number, but it is hard to picture unless you have driven through a burn scar or watched smoke turn noon into a strange orange evening. On the ground, wildfire acreage is not a neat block of red on a map. It is a patchwork of blackened hillsides, surviving green islands, closed roads, ash on windshields, nervous livestock, and residents comparing evacuation bags like they are discussing luggage for the world’s least relaxing vacation.
In Western states, people often describe wildfire season as a second calendar. There is winter, spring, summer, smoke season, and then the hopeful return of rain. A mountain town may start the day with blue skies and end it with helicopters thumping overhead. A rancher in the Plains may watch a grassfire race across a horizon that looked harmless an hour earlier. A family in California may know exactly which box holds passports, medications, pet carriers, and insurance documents because they have practiced leaving before.
One of the most striking experiences related to wildfire maps is how uneven the damage can be. A road may divide two worlds: one side scorched to mineral soil, the other side still standing, as if the fire changed its mind halfway through lunch. Firefighters call this behavior by technical names involving wind, slope, fuel, and intensity. Residents usually call it luck, heartbreak, or both.
Smoke is another part of the experience that maps do not fully capture. You may live hundreds of miles from the flames and still wake up to a red sun, scratchy throat, and air-quality alerts. In that sense, wildfire acreage is not only a local land issue. It becomes a regional health issue, a school issue, a tourism issue, and sometimes a mental-health issue. People cancel hikes, move soccer practice indoors, tape gaps around windows, and check air monitors with the devotion usually reserved for sports scores.
After the flames, the experience changes again. Burned landscapes can be quiet in an almost startling way. Then comes the work: clearing debris, repairing fences, restoring power, stabilizing slopes, reseeding, reopening trails, filing claims, rebuilding homes, and preparing for floods that can follow when rain hits fire-damaged soil. Communities learn that wildfire recovery is not a weekend chore. It is a long, expensive, emotionally exhausting process.
That is why the mapped ranking matters. It gives readers a quick visual sense of where land is burning, but the lived experience fills in the human details. Behind each acre is a place someone hikes, hunts, grazes, studies, protects, remembers, or calls home. The map may be colored in red, but the story is written in ash, sweat, planning, and resilience.
Conclusion
The states losing the most land to wildfires are not always the states with the most dramatic news coverage. Alaska can dominate acreage because of enormous remote fires. California can dominate public attention because homes, infrastructure, and people sit so close to flammable landscapes. Oregon, Washington, Idaho, Arizona, New Mexico, Colorado, Nevada, Oklahoma, Texas, and Florida all show that wildfire is not a single-state problem or even a strictly Western problem.
The wildfire map is best understood as a living risk portrait. It shows where fire has burned, hints at where conditions are changing, and reminds us that acreage is only one measure of impact. A smart response requires better land management, stronger homes, safer evacuation planning, prescribed fire where appropriate, better public alerts, and a public that treats wildfire preparation as normal life maintenance, right up there with changing smoke detector batteries and pretending we will clean the garage next weekend.